Showing posts with label Nuclear. Show all posts

Wednesday, July 31, 2024

Ford Channels McGuinty in directives to new Energy Minister

Ontario recently swapped Energy and Education Ministers. Early comments from the new Minister of Energy (and Electrification), Stephen Lecce, indicate a type of student we see far too often in the fields of environment and energy; one willing to take direction without putting much thought, or study, into them. Of particular concern are comments on exporting power. In a recent interview[1] Lecce describes ‘three key priorities” in his “marching orders” from the Premier. Presumably the current Premier, Doug Ford, but maybe not.
First, we are absolutely committed to ensuring an affordable electricity system for families, seniors and small businesses.
Second is the expansion of clean-energy generation for the people of Ontario. We already have one of the cleanest grids on the continent. The vision is to continue to generate more as our population increases, our industry expands and our manufacturing electrifies.
Third is to help build out Ontario as a clean-energy superpower, able to export our energy – as we already do. We’re already a net exporter to New York and other places. We want to strengthen our clean-energy advantage and export technology and electricity around the world, particularly in the United States. [emphasis added]
I have long-standing concerns about exports.My first blog post to garner significant attention, and spur mainstream stories bringing comments from then Premier Dalton McGuinty, reported on the high exports and negative pricing of January 1st, 2011. “A full decade later I was still writing estimates on losses incurred on exporting electricity, which grew rapidly along with the growth in supply spurred by McGuinty’s Green Energy Act. This post is going to build off of another discussion on losses on exports in the context of “affordable electricity for families”, using a presentation I’ve added to reporting built on basic data shared from the system operator (IESO)..

screen capture from Power BI reporting

Wednesday, August 9, 2023

Opportunities and Obstacles for nuclear in Alberta

The prospects for new nuclear reactors has been a hot topic this summer, particularly following Ontario’s announcements exploring new builds of large reactors and additional consideration of smaller (modular) reactors (SMRs). Ontario had been exploring SMR’s with other provinces, initially with New Brunswick and Saskatchewan, and more recently Alberta joined the group. Alberta’s electricity mix last week became a second hot topic. The current Canadian government is also a topic as it threatens to force, "a net-zero electricity system by 2035."

This seems an appropriate time for me to revisit Alberta’s electricity system in search of a route to nuclear power in that province.

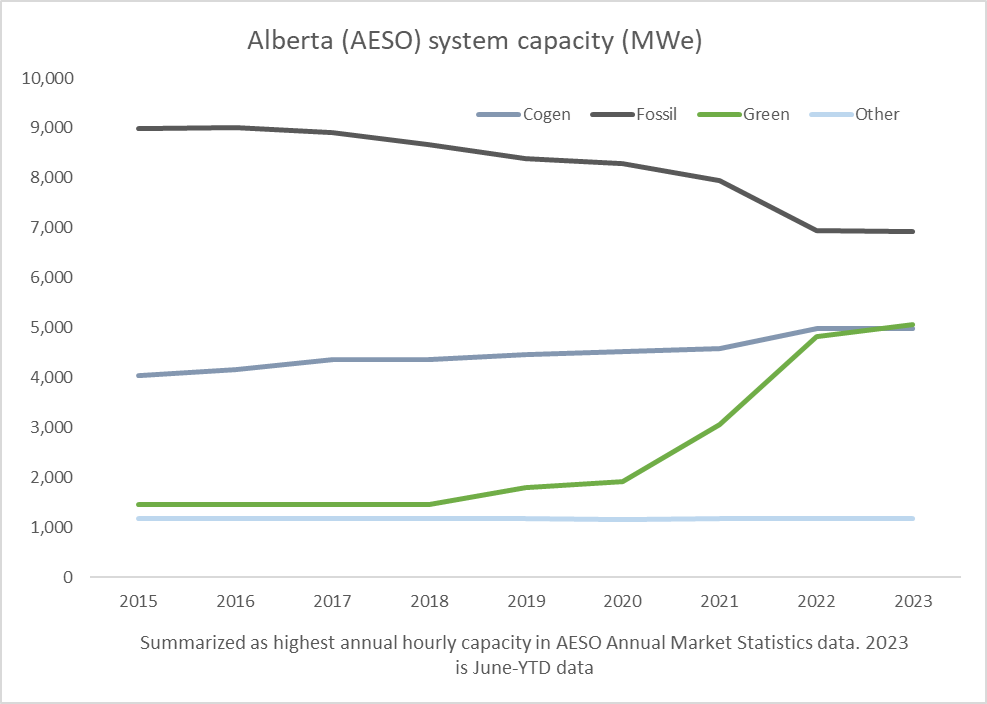
Alberta’s electricity system underwent radical changes since I wrote on a former government’s activities in 2017’s Alberta.Bound. In this post I’ll concentrate on data from the Alberta Electricity System Operator (AESO) in this post, mostly from their Annual Market Statistics data visualization which currently contains data from 2015 thru to June 2023. The AESO's data indicates rapidly declining potential for nuclear in the AESO’s market in recent years.

Alberta’s coal generators saw the wish for them to disappear grow for over a decade. In 2012 I wrote on the rapid opposition to federal regulations that would see emissions from new coal-power plants limited to something impossible with any operational technology, and a maximum lifespan of 50-years mandated, then, through emissions regulation, the goalpost essentially moved to 40 years within Alberta, and then a 2030 death data was mandated, and other generation sources incented. Alberta's Climate Leadership Plan (CLP) of 2017 noted the, "drive toward the development of 30 per cent of electricity generation capacity from renewable sources connected to the grid by 2030." [emphasis added] While the CLP itself spoke of efforts to remove, "policy barriers of the conversion of coal units to natural gas," many of the people that set policy had already created an understanding that ,"Two-thirds of the coal-generating capacity (4200 MW) will be replaced by renewable energy, and one-third (2100 MW) by natural gas."

Summarizing the changes in generation capacity since 2016 by grouping fossil fueled generators together (gas, coal, dual fuel), “green” together (wind, solar and storage), displaying co-generation alone and lumping everything else in under “other” (including hydro), the decline in generating capacity of firm generators fueled by coal and/or gas is apparent, as is the, related, meteoric rise of “green” ones.


Tuesday, June 6, 2023

on the risk of power shortages in Ontario this summer

A regulatory body with a mission “to assure the effective and efficient reduction of risks to the reliability and security of the grid,” delivered its “Summer Reliability Assessment” for North American jurisdictions last month. The brief news release for the document:
warns that two-thirds of North America is at risk of energy shortfalls this summer during periods of extreme demand. While there are no high-risk areas in this year’s assessment, the number of areas identified as being at elevated risk has increased. The assessment finds that, while resources are adequate for normal summer peak demand, if summer temperatures spike, seven areas — the U.S. West, SPP and MISO, ERCOT, SERC Central, New England and Ontario — may face supply shortages during higher demand levels.
Toronto Centre MPP, the NDP’s Peter Tabuns, used that document to launch an attack on the government’s management of the electricity system in the Ontario legislature on June 1st:
“…the body that oversees electricity grids in North America reported that Ontario risks power outages this summer. In fact, Ontario is the only province in Canada that is rated with elevated risk that it can’t meet peak demand. After five years, this government’s policies of cutting funding for efficiency and conservation, of demolishing wind farms and cancelling other renewable projects have led to this.”
This has gotten the rabble roused - if the media is any indication. The Toronto Star and CTV news both reported on topic. CTV’s reporting included comments from an expert, who advised, “There really is not any cause to be alarmed”, but also commentary from the opposite sort - politicians Tabuns and the leader of Ontario’s Green party.

Since this topic doesn’t seem to be going away I’ll explain some of the structure and content of reporting on reliability, and address the substance, or lack thereof, in the criticism of the government as reducing reliability through canceling plans for additional ‘green’ energy.

Wednesday, July 31, 2019

OPG's nuclear facilities are now the major cause of increasing electricity costs

Ontario rates are on the rise again, after going largely unchanged for the final two years of the previous, Liberal, government. Many consumers won't realize the 7% increase during the first half of 2019 as the impact is hidden by subsidies, which have grown to about $4 billion a year in the recent provincial budget. In stark contrast to past years, this year it is publicly owned Ontario Power Generation (OPG) nuclear units driving the increase. I estimate all supply costs up a little over $400 million (nominal) during the first half of 2019, while the cost of OPG's nuclear output is up a little under $500 million.

This article is going to be about electricity rates - promised and realized. It will touch on too many complex areas I've spent too little time on to understand fully, but enough to understand Ontario’s rate-setting process cannot deliver reliable pricing on regulated nuclear supply.

Ontario's government announced it was "moving forward with nuclear refurbishment at Darlington Generating Station," in January 2016. That station has 4 reactors - the last 4 new-builds in the province, with the last of those entering commercial operation 25 years ago.
The average cost of power from Darlington nuclear units post-refurbishment is estimated to range between $72/MWh and $81 MWh, or 7 and 8 cents per kilowatt hour.
The low end of the estimate, $72/MWh, is what Ontario's consumers were paying for supply from OPG's nuclear power plants at the time of the announcement in 2016. Today we are paying $89.70, which could generously be considered as just above the high end of the estimate (adjusted to real 2015 dollars). This is somewhat explained by the inability of the regulator, the Ontario Energy Board to set a rate in 2017, but another 6% rate hike is already baked in for 2020, so we will be back at the high end of the estimated range in 2020 regardless.

It is not, however, accurate to blame the recent rate escalation on the refurbishment project.

Thursday, March 7, 2019

Available low-cost electricity not utilized in Ontario

All figures are estimated (view in workbook)

In preparing my previous post I created a graphic posted separately on Facebook and Twitter. The graphic got more views than the post I edited it out of.

Comments on the original graphic included thoughts from the "electrify everything" perspective. I responded with too much caution, noting shrinking supply. Having given topic some more thought, I've added dumped exports as supply that has been available to Ontarians over the past years, on top of curtailed potential supply and under-utilized gas generators. In this post I hope to provide some context to the graphic, and show why coming changes in supply don't present a challenge for meeting Ontario's annual electricity needs, if not its capacity requirements.

Friday, March 1, 2019

Value lessons from Ontario electricity statistics

Data - and lots of it.

While I'll try to prevent this post from sliding into an abyss of Ontario electricity statistics, I'll be citing provincial data as the basis for discussion about public understanding being restricted by the presentation of data from official sources, and present new views of generally unreported data that would benefit literacy in valuations of electricity sources - an area where reckless ignorance blooms again and again.
but enough about academics, let's dive in!

The old standard of valuing generation sources is the Levelized Cost of Electricity (LCOE ). I was particularly pleased in late 2015 when a report from Ontario's Auditor General included a figure (5) indicating the cost and quantity of energy sources for 2014. I was more pleased a few years later when I received figures from a freedom of information (FOI) request with the same information for years 2007-2015. While I think the data is terrific, when I wrote about it I cautioned on presenting LCOE, "stressing these calculations deserve a big asterisk and lengthy footnote on the impacts of things such as curtailment and capacity payments." 

I have now done the data work required to add that lengthy footnote on curtailment and capacity payments.

I am certainly not unique in hoping for superior valuation tools to LCOE: the U.S. Energy Information Administration (EIA) has developed a  Levelized Avoided Cost of Electricity (LACE) metric, and the International Energy Agency (IEA) a Value-Adjusted Levelized Cost of Electricity (VALCOE - see pg 41). LACE is intended to value the cost (of alternatives) avoided by the generation, with the intent LACE > LCOE would signal a good project. VALCOE attempts to recognize the different capabilities of sources in providing firm capacity and flexibility. The specifics are less important than the principles: not all generation is of equal worth to systems that are intended to minimize loss-of-load situations. Concrete examples of LUEC's limitations will help conceptualize the issues that have people looking for better valuations.

Before I discuss my data I will note one other frequently cited source of Unit Cost in my province (I regard LUEC and LCOE as interchangeable terms): the Ontario regulator. Their most recent explanation of regulated rates includes a table (3) indicating hydro at 6.2 cents per kilowatt-hour, nuclear at 7.7, wind at 15.9, gas at 18.8 and solar at 51.3 c/kWh. I'll show replacing the OEB list's lower cost supply with gas is likely to lower total costs.

I have collected hourly data for the transmission-connected (Tx) generators reported by Ontario's system operator, including imports, and I've estimated (hourly) distribution-connected generation (Dx), curtailed supply, and contracted cost, either by unit generated (or curtailed), or by capacity required to be available. My base union query in working the data has over 16.4 million records. I will not repeat the word "estimate" in this post but simply note this one time it may be applied to everything (my work and the numbers from the IESO and OEB I cite).  

Here is my summary of annual generation and costs from 2008-2018:

Saturday, August 26, 2017

regarding Ontario Electricity Generation and Costs, 2007 - 2015

This week I was handed some data indicating, by supply type, electricity generation and costs in Ontario. The data was a hard copy response of the IESO to a freedom of information request. There's nothing in the data that will surprise readers of my work, but perhaps it's time for a refresher, as today I read one flip comment by a mainstream journalist, joking they'd like to see "Ontario families can no longer afford skyrocketing nuke costs," and an opinion piece on the public broadcaster's site which included:
...as data from the [International] Electricity System Operator clearly shows (sic), it’s nuclear and gas plants that are responsible for the lion’s share of increases. 
"Clearly."
It is time for a refresher.

Some background on the data I'll share. The 2015 Annual Report from the office of The Auditor General of Ontario included a chapter on "Electricity Power System Planning." The entire chapter contained a wealth of information and continues to be cited frequently, but for those chasing hard numbers one particular star of the work was a figure revealing the quantity, and cost, of generation from various sources, inclusive of not only the larger generators frequently reported by the IESO (the "I" is not for international, but it is the electricity system operator), but also the seldom reported distributed generation - which is where most solar exists.

The freedom-of-information requests handed to me included this request:
Breakdown of Generation Cost by Energy Sources for the years 2007, 2008, 2009, 2010, 2011, 2012, 2013 and 2015. The Breakdown for 2014, which was included in the Annual Report of the Auditor General of Ontario, is attached as reference.
The data table that follows responds fully with the request - I have only reformatted it:

Thursday, August 10, 2017

Ontario may contract more imports from Quebec - badly

On the morning of Tuesday August 8th La Presse published an article reporting on a draft contract which would see Ontario pay Quebec approximately $500 million a year for the ability to import 8 terawatt-hours of electricity. By late morning the office of Ontario's energy minister denied an agreement was reached, and the ruling Liberal party's press office was slamming the opposition party for "spreading misinformation."
Perhaps nothing will come of the proposal, but it's worth noting what constituency it is designed to appease, how that appeasement impacted the draft agreement, and the concerns all Ontarians should have with the processes, and institutions, involved in the province's electricity sector.

A timeline surrounding the leaked draft document dated June 22, 2017:

  • during May Ontario's Minister of Energy GlennThibeault and this Quebec counterpart, Pierre Arcand, discuss "the possibility of further enhancing electricity trade in order to cost-effectively improve our respective electricity systems," [source]
  • La Presse's report, translated on Google Chrome, includes, "Thibeault sent a letter to his Quebec counterpart...on June 13 to explore the possibility of entering into a new long-term agreement to purchase electricity",
  • June 20th Peter Gregg "takes on the role of IESO President and CEO",
  • June 22nd Hydro-Quebec's Steve Demers writes a "Dear Peter" letter to the new head of Ontario's system operator introducing a written proposal valid until July 14,
  • July 27 Ontario's Thibeault writes the June offer was "inconsistent with our discussions in May", notes following discussions between staffs of Premier's Couillard and Wynne HQ "would be instructed to work collaboratively with IESO on enhancing electricity trade..."

I think Thibeault's July 27th is very good. To communicate why, I will focus on a short technical quote from the leaked draft agreement which explains the shortcomings of Hydro-Quebec's proposal. 

First I'll note 8 TWh, the proposed annual import level, is only slightly higher than the total annual imports into Ontario from Quebec (much of which will be wheeled through to New York). There was some noise about whether the amounts were feasible with existing infrastructure: they are.


Friday, June 23, 2017

Solar: Ontario's Base-Value Power

What is the generation source least valued by Ontario's electricity market in 2017?

That is the question I asked on twitter the other day. I know it's not the most serious format, it's a small sample size, and my running the poll means there will be selection bias in the responses. I did invite others with different views of the energy world to share it - but they did not.


I got some feedback that the question was unclear. While there are multitudes of factors impacting/corrupting the metric, this question is precise. The IESO allegedly operates Ontario's electricity market, they do publish summaries for hourly generation by fuel (xml format) and they do publish an Hourly Ontario Energy Price (.csv format).

The least valued "fuel" - or generation source - this year as the 22nd of June, is the lowest valued by a big margin, lying 29% below the next least valued.

The lease valued source is the source least expected to be the least valued.

The least valued source is solar.

Which shouldn't come as a surprise. 
I'll briefly review the theory, put Ontario's experience in a broader context, and finally cherry pick one day to examine. Cynics may be surprised the day is June 12th, which is the highest demand day of 2017.

Monday, June 5, 2017

Ontario electricity: How we got to here

It is the best of times, it is the worst of times.

The best: over the first five months of 2017 the reporting from Ontario's system operator (the IESO) indicates less than 2 terawatt-hours (TWh) of electricity has been generated from natural gas fueled facilities, with the remainder of 59 TWh generated on the IESO system coming from near-zero greenhouse gas emission sources. Since April 2014 coal has not been burned to produce electricity in the province. Emissions intensity of generation over the first 5 months of 2017 is approximately 14 grams of CO2 equivalency per kilowatt-hour (g CO2 eq / kWh), which is particularly low for a jurisdiction receiving less than 30% of its generation from hydro-electric sources.

Some things will be viewed as good, or bad, depending on the perspective of the observer: the last two months demand of IESO supply has been lower than in any month since 1994. If "conservation" is good, it would seem Ontario has it good. Supply is plentiful. So plentiful the IESO reported 19 per cent of of "wind energy produced in the province" was dispatched down (curtailed) in 2016, and Ontario Power Generation (OPG) reported 16% more hydroelectric generation could have occurred if not for surplus supply. The numbers on the surplus in 2016 are noteworthy: 7.6 TWh curtailed equates with 5.5% of the 137 TWh "withdrawn from the high-voltage transmission system by Ontario loads", but a further 21.8 TWh was exported meaning total supply (including imports) was 21.5% more than those loads required.

Some things are now viewed as bad, that were previously viewed by some as good. Regulated Price Plans charging residential, farms and other small business consumers what the government had longed planned to have them paying are suddenly being cut steeply through a debt scheme to be paid off whenever down the line. In order to keep cost hikes in line with previous projections the government already had to abandon first the collection of a Debt Retirement Charge and then the provincial portion of the Harmonized Sales Tax - some feel the lower government revenues a negative.

I've written often on the causes of higher rates in Ontario. I am inspired to do so again by the uncovering of documentation from a previously hidden Integrated Power System Plan in 2011. Shawn-Patrick Stensil, of Greenpeace, acquired the documents through a long Freedom-of-Information (FOI) process.

This post examines 3 long-term plans' annual forecasts of Ontario's electricity supply mix, with a focus on the capacity mixes forecast for 2016 compared to the current actual supply composition.

The current situation is not accidental.

This is how we got to here

Wednesday, May 17, 2017

India's government approves construction of 10 nuclear reactors

India's government has approved construction of 10 nuclear reactors that will have a combined capacity of 7 GWe - essentially doubling the country's current nuclear capacity.

Cabinet approves construction of 10 units of India’s indigenous Pressurized Heavy Water Reactors (PHWR):
Boost to transform domestic nuclear industry 
In a significant decision to fast-track India’s domestic nuclear power programme, and give a push to country’s nuclear industry, the Union Cabinet chaired by the Prime Minister Shri Narendra Modi has given its approval for construction of 10 units of India’s indigenous Pressurized Heavy Water Reactors (PHWR). The total installed capacity of the Plants will be 7000 MW. The 10 PHWR project will result in a significant augmentation of nuclear power generation capacity.
India has current installed nuclear power capacity of 6780 MW from 22 operational plants. Another 6700 MWs of nuclear power is expected to come onstream by 2021-22 through projects presently under construction. 
As the government marks three years of its nation and people centric governnace, in a first of its kind project for India’s nuclear power sector, the ten new units will come up in fleet mode as a fully homegrown initiative. It would be one of the flagship “Make in India” projects in this sector.

Friday, December 30, 2016

Nuclear Ontario - and giving electricity away

first posted on cold air currents.

Since I posted Reliable Electricity Generation Capacity declining in Ontario the IESO's NPCC 2016 Ontario Interim Review Of Resource Adequacy was published.
It's exciting stuff:
The Independent Electricity System Operator (IESO) submits this assessment of resource adequacy for the Ontario Area in accordance with the NPCC Regional Reliability Reference Directory #1, “Design and Operation of the Bulk Power System.” 
Spoiler alert!
The report concludes Ontario's system can meet Loss of Load Expectation (LOLE) criteria for the 2017 to 2020 planning period once Emergency Operating Procedures (EOP) are assumed. EOPs are indicated to be essentially 1/3rd public appeals to reduce consumption, and 2/3rds voltage reductions.

Phewff.

I wrote "With the exception of 2013 the capability at peak has declined every year since 2010, despite IESO-connected generator capacity being greater now than it was six and a half years ago," so I thought it only fair I offer a brief analysis of how the IESO is meeting the reporting requirements for resource adequacy - and the repercussions of how they are doing so.

Monday, June 20, 2016

OPG's application to hike nuclear power rates harms credibility

The average cost of power from Darlington nuclear units post-refurbishment is estimated to range between $72/MWh and $81 MWh, or 7 and 8 cents per kilowatt hour.
So announced the Ontario government in a January 11th, 2016 news release.
137 days later Ontario Power Generation (OPG) filed an "Payment Amount for Prescribed Generation Facilities" application with the Ontario Energy Board, asking for rates for supply from its nuclear generators to rise to $99/MWh by 2021.
data from OPB_Exl1-1-1_Att1_OPG_RevenueRequirement Work Form_20160527.xlsx filed at OEB
I find the rate application disheartening.

Anti-nuclear forces will find it very useful.

Wholesale reporter Keith Leslie wrote of "a whopping 69 per cent increase...over the next five years" with quotes from his standard go-to Jack Gibbons, who just days earlier had an editorial in the Toronto Star arguing for the closure of the nuclear reactors at Pickering using some of the same arguments he had discredited 2 years ago (by me in June, and by the IESO/OPA in October), and some other sound-bite emotive appeals developed in the 1970's. [1]

Which doesn't mean Pickering shouldn't be closed.

Having a better record with OPG's financial arguments than they themselves do, I feel obliged to see if OPG's management was just inept in formulating a rate hike that I suspect more likely to scuttle the refurbishment of Darlington's reactors than extend the life of Pickering's, so I'll explore the production and revenue requirement totals with some historical context, and review the poorly chosen "smoothed" option.
This rate hike request reveals some things about what OPG has become, and also reveals shortcomings of the Ontario Energy Board (OEB) in regulating Ontario's electricity sector.

Sunday, April 17, 2016

10700: Ontario's beastly number

Planning Ontario's electricity sector should have been a topic of interest when, on December 2nd 2015, the province's Auditor General included a chapter on Electricity Power System Planning in her annual report. The report received a lot of attention, but our power system planning process did not. The fall of the arbitrary, yet long-standing, 10700 megawatt target for non-hydroelectric renewable energy would indicate a return of professionalism in planning Ontario's electricity sector.

Before 10700 was the Integrated Power System Plan (IPSP) process.

The Liberal government, elected in the fall of 2003, had created the Ontario Power Authority (OPA) largely to develop an IPSP professionally, if not entirely independently. The process had, in its early stage, the OPA prepare supply mix advise for the Minister of Energy. Some notable aspects of the December 2005 advice:
  • Preference for renewable sources of energy...
  • Renewables, including wind, small hydro (waterpower) projects and hydro purchased from other provinces (referred to as “hydro imports” in the balance of this report), can provide a significant share of capacity and energy...
  • ... conservation and new renewable sources would more than meet all of Ontario’s growth in demand for electricity by 2025. This would not, however, replace the loss of capacity from the retirement of other supply sources...
  • Together, natural gas and renewable sources can replace coal generation...
I've added emphasis, but quoted from the OPA verbatim.
The OPA suggested to the Minister that by 2025 "renewables" be 15,500 megawatts (MW) - inclusive of about 8000 MW of existing hydro capacity and most likely the 1,250 MW increase in the Ontario-Quebec intertie capacity. [1]

Six months later, in June 2006, a Supply Mix Directive from the Minster tasked the OPA with the development of an IPSP (plan) including:
Increase Ontario's use of renewable energy such as hydroelectric, wind, solar, and biomass for electricity generation. The plan should ... increase the total capacity of renewable energy sources used in Ontario to 15,700 MW by 2025.
The IPSP final form, delivered August 29, 2008, planned for 16,164 MW of renewables by 2025: 10,768 MW of hydroelectric, 4,251 of wind, 656 of bioenergy and 488 MW of solar. [2]


opa2005to2015actComp
Spreadsheet comparing OPA Supply Mix Advice from 2005 to estimated actual 2015 data.
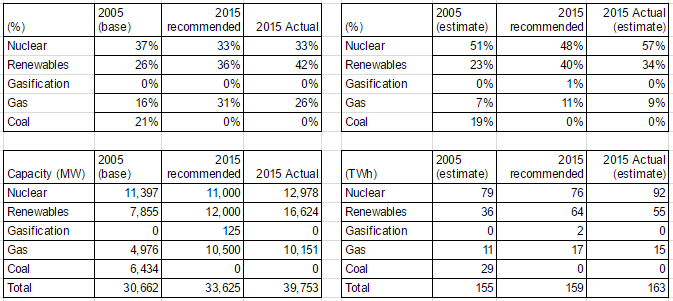
1st posted in Reviewing a 2005 plan for Ontario’s electricity supply in 2015
19 days later, on September 18th 2008, a Minister of Energy and Infrastructure essentially killed 3 years of work with an unintelligible directive amending the 2006 Supply Mix directive.

Friday, July 6, 2012

Week 26 Reporting: Nuclear productivity highs and continued pricing woes

I've had a lull in posting as I am developing some more reporting on my data site to support future blog posts.
Here's a post to indicate how my Weekly reporting demonstrates the supply mix, pricing, and export issues frequently noted on this blog - and increasingly elsewhere.

Weeks 25 and 26 are amongst the highest demand weeks of the year.  Peaks are far higher than in January, but total weekly consumption is yet to surpass week 3.

Summer is now our peak (hourly) demand period, which should raise some supply requirement issues.  During the highest demand week in January, peak demand was ~7000MW above the minimum demand for the week.  During the heat of week 25, demand rose to ~12000MW above the minimum demand for the week (essentially doubling the week's minimum demand).

Tuesday, January 17, 2012

A Sober look at Ontario’s 2011 Electricity Figures

"He uses statistics as a drunken man uses lamp-posts...for support rather than illumination."
                                    -Andrew Lang (1844-1912) Scottish poet, novelist and literary critic


Ontario’s Independent Electricity System Operator (IESO) issued a news release on January 6th titled,“Composition of Ontario’s Electricity Supply Mix Continues to Change: Consumer Response Supports Reliability.” The introduction posits there were three trends highlighted in the data; “increasing production from renewable resources, reduced dependence on coal-fired units, and a more active role for consumers in managing their consumption.”   Not exactly the 3 trends I'd look for
  • The 'customers' most active in curtailing peak demand are businesses, as Parker Gallant and I demonstrated in a recent article. Many of them pitch in by closing up altogether;
  • Use of coal-fired generation is reduced because the periods we need it are down, but at peak demand we relied on coal-fired generation (I wrote on that here);
  • There is no trend to increasing production from renewables in the IESO data.
There is a brief uptick. From only the data presented by the IESO, summing up hydro and wind the numbers go from 39.7 TWh in 2008 to 40.4TWh in 2009, 33.5TWh in 2010, and then we have a singular point as an uptick in 2011, to 37.2TWh. While up on a dry 2010, the total renewables figure is unimpressive against a longer trend. In the past 22 years, renewables have infrequently produced less output than in 2011.

Sunday, January 1, 2012

New Year, Same Stories, Old Professions


 Goodbye 2011.
This blog was new as 2010 turned to 2011. My first post of 2011 noted huge exports in December of 2010, negative pricing records for January 1, 2011, and record wind production in hour 21 of January 1st. It took about a week before the first reporter picked up on the subsidized exports story, which generated some interest in the mainstream media (MSM). Remarkably, in hour 18 of January 1st, 2012, wind would again set a production record (1633MW).

Comparing the immediately available data for New Years' Day 2012 to the 2011 data, we see why the price disaster of 2011 was curtailed, to only intermittent periods of negative pricing, this year.
Nuclear was idled: one unit at Darlington just for this weekend (we'll see if they get it back up for tomorrow's deep freeze), and one at Pickering they seem to have decided not to bother with this season (a Bruce A unit is also offline for a fairly substantial project).

Net Imports are only up compared to last year: 1/1/2012 we were still a net exporter - of over 1000MW/hour

Monday, November 28, 2011

A Dubious Distinction: Another Wind Record For Ontario

Sunday November 27th saw a record for hourly electricity production from Ontario's wind turbines.
Hour 10 has 1427MW recorded, which is 1MW higher than the 1426 recorded for hour 9 only two Sundays before.(endnote 1)  The day was also notable as mild temperatures further reduced Ontario's demand, which had already been trending down for the previous 6 weeks.


Comparing hourly production data from Sunday November 27th, 2011, to the production from Sunday, November 28th, 2010, and estimating hourly demand from intertie activity, shows that the additional wind generation of 20,119 MWh coincided with a drop in demand of approximately 38,365MWh of demand.(endnote 2)   That required over 58GWh  of other supply to be curtailed, or exported, which is essentially all production from natural gas and coal that occurred in 2010.  Cas and coal reductions were only about 25.6GWh, nuclear 22.1GWh, and exports were upped by 10.5GWh.


Nuclear Hydro Wind Gas Coal Other Ontario Demand Net Exports
2010 240,696 83,415 6,782 52,156 8,082 2,424 371,778 21,008
2011 218,610 81,907 26,901 29,280 5,242 3,046 333,413 31,573
Variance -22,086 -1,508 20,119 -22,876 -2,840 622 -38,365 10,565


Saturday, November 26, 2011

Perspective on Ontario's Electric System Operator 18-Month Outlook


On our American neighbour's Day of Thanksgiving, the Ontario's Independent Electric System Operator (IESO) released it's latest 18-Month Outlook, to May 2013.  The headline summary from the press release 
was that "Over the next 18 months Ontario will continue to have an adequate supply of electricity to meet consumers' needs."
That hasn't been an issue for years, and the present's premier problem was emphasized as the calendar changed over to the US Black Friday, the day American retailers allegedly move from the losses of the previous portion of the year to the profits of the holiday season. Ontario was paying $31.80/MWh to any market that would accept our exports, and, finding limited takers, Bruce Power was being forced to reduce output from it's nuclear units.  Between the 1100MW we found export markets for, and the 300MW we would pay Bruce to prevent the production of, the IESO managed to compensate for the inconveniently high wind output of  1413MW.

Wednesday, October 12, 2011

Value, LUEC Limitations, And FiT Failure


The comparative value of  of each generation source in Ontario’s electricity system is measurable.  I’ve written on this before, and recently read a couple of encouraging articles noting the shortcomings of the LUEC (levelized unit energy cost), or LCOE (levelized Cost Of Electricity) tools in evaluating electricity generating technologies.[i]   Presenting some of the data I’ve collected, in a slightly different way, will emphasize the need for a value analysis that also considers the supply mix, and demand characteristics..  The analysis indicates Ontario’s recent electricity planning foibles will not provide a low-emissions, sustainable, electricity supply.