Showing posts with label Emissions (GHG). Show all posts

Monday, March 15, 2021

Ontario's electricity system has not yet passed gas

Ontario's electricity system has not yet passed gas 1 Ontario’s electricity system includes generators fueled by natural gas. This is suddenly a hot topic as a campaign lobbying councils to say no to this type of generation moves through municipalities. The “no gas” lobbying appeals to a desire to reduce greenhouse gas emissions, exploiting predictions of increased use of natural gas in generating electricity in the province. This article will explore what entities have been the key drivers of emissions in Ontario’s electricity system, the credibility of the body being cited predicting increased generation fueled by natural gas and, if all goes well, convince the reader they are not willing to decrease global carbon emissions at any cost.

Background on the IESO’s pretend market

My previous post reconstructed a method to estimate losses on electricity exports out of Ontario. The measure does not indicate Ontario would be better off if it didn’t export its excess, but that Ontario would be better off with data discipline and consistent metrics capable of informing, and influencing, the managers of the system. Most years we pay more, per unit of electricity, and receive less from exporters of that electricity. It’s a bad trend, but not one Ontario’s electricity system has been structured to notice.

In Ontario the system is operated by the IESO. The IESO’s system includes what should be called a pretend market - it was called a hybrid market when introduced in 2005 after a collapsed attempt at a real market, but it’s deteriorated significantly since then. From a recent report:

...Over 98% of Ontario’s generation costs are controlled through either regulation or contracts, and even the fixed costs of most of the assets that trade on the market are contracted. As a result, less than 2% of the total system costs are actually price-exposed and influenced by the market (the dark blue area)
The creation of a market for electricity in Ontario revealed itself as a fantasy in four acts:
  1. the freezing of the market price shortly after its birth in 2002 killed any chance of merchant generation getting built;
  2. the introduction of the global adjustment mechanism (2005) separated the contracting of new generation from a need for revenue from sales into the market, and was accompanied by regulating rates for public Ontario Power Generation (OPG) nuclear and very large hydroelectric generators;
  3. the introduction of contingency payments to keep coal generators operating after the market collapse of 2008, and,
  4. Regulating the rates for the remainder of OPG’s hydro-electric facilities for 2015.

Sunday, August 12, 2018

Carbon Con: It's only economics

part 2 in a series imagining the participants at a 'Comic Con' like convention for reducing greenhouse gas emissions. The first post was ECO communication
"Assume I'm an economist..."

Way back when I began the second post to this blog with that ask. Over seven subsequent years of research, data analysis and communicating on electricity supply, emissions, and markets, I've since revised my perspective.
A man walks into a Doctor's office and says, "Doc, it hurts all over when I do this."
The doctor prescribes of a Pigouvian tax.
graph from Wikipedia 
In an April blog post I hinted at my envy of those utilizing richer media tools - from richer graphics to audio/podcasts to video. At that time a group called the EcoFiscal Commission had just released, on their attractive website, "Clearing the Air: How carbon pricing helps Canada fight climate change." A beautifully formatted .pdf provided more depth than the web page, and all were accompanied by short video explainers. The work features 3 case studies of jurisdictions with pricing of greenhouse gas emissions - only 1 of which has significantly reduced emissions. I was going to focus on these case studies but they're really a footnote to addressing a bigger issue, enunciated by in a video clip Ecofiscal Chair Chris Ragan:


"Canadians do care about climate change but they also care about the economy... until Canadians are presented with a solution that makes sense for both the environment and the economy they are not going to put this at the top of their list.
Carbon pricing is that solution."

As they say outside the hallowed halls, "to a hammer everything looks like a nail."

I am going to rebut the evidence supporting the "Carbon pricing is that solution" claim, while recognizing why there could be roles for economists to play following the introduction of The Paris Agreement.

I realize a credibility gap probably exists as the Ecofiscal Commission is stacked with prominent names whereas I am known by far fewer and often as an opponent of "green" energy - and/or a proponent of nuclear energy. To encourage reading on I'll note Ontario has greatly lowered its emissions since I began blogging - a fact which need not be credited to me to any extent, but it also has much less generating capacity from "green" energy, and more from nuclear, than was planned at when I started arguing for retaining nuclear and halting the wind and solar subsidies.[1] Certainly many names from Ecofiscal are recognizable, but I recognized none as being active and influential where emissions have been significantly reduced.

Monday, April 16, 2018

Carbon-Con: ECO communication

A couple of weeks I was asked about potential ways to collaborate with reputable sites. I put some thought into that before responding that simply an association with me could bring a site to disrepute, but my thoughts on communication persist. From the belligerent uttering of a federal Minister on a Sunday talk show, to a media blitz from an organization marketing itself as expert on economic tools to reduce carbon emissions, to the Ontario report I'll feature in this commentary, it's been as if a convention of climate change alarm is occurring.

A Climate convention.

Comic Con (short for convention) is a really big event now, which makes some sense in this era of communication. Text is a low impact medium - the sites adding audio and video, integrating with podcasts, have a huge advantage. As the comic and related genres (science fiction, fantasy and superhero) grew from print to screens of all sizes, the graphics and sound growth has simply piled success onto success. The term "simply" recognized almost all characters can be grouped into good or bad.

Perhaps due only to my musing about communication, collaboration and branding, I thought the polarized nature of climate, and energy discussions, make Comic Con a model for communication and promotion in the 'clean tech' industry.

I'd prefer to be a hero, but realize the model needs villains too.

What I hope will be found in my little section of this Carbon Con is data-driven iconoclasm delivered through research, competent data handling, pointed if not visually appealing graphics, and full contact criticism of those blissfully unaware they deserve to be blisteringly opposed.

What many will find is villainy - I've been accused as anti-wind, anti-renewable, anti-conservation, pro-nuclear, disrespect and misogyny. I don't agree with that entire list, but I'm okay with being the villain if it makes for better heroes.

My concern with the profession of professing concern about carbon emissions begins, as most things do, with religion.

Thursday, March 1, 2018

Review of 2017 electricity supply in Ontario

You purchase a  full 9-unit container of energy .
The 3 men who deliver it pour out 2 units out while lecturing on consumption. 
They imply you should make more yourself as they leave.

A couple of months have passed since I last posted to the blog. This may be due to writer's block, or a lack of ambition - or maybe I was wisely waiting until I had something nice to say!

With growing knowledge, and curiosity, I seem to muddle all little issues into the broad themes I deem important - and not only for energy. In this post I'll touch on metrics from 2017 the reader may be looking to this blog to find, with hopes of connecting the data to bigger issues.

There are many possible headlines from an annual analysis:
  • electricity "demand", as reported by the system operator was down, to levels not seen in decades
  • supply generated from fossil fuels (natural gas) was sharply down too, and again to levels probably not seen in over over half a century
  • prices for consumers on regulated price plans were sharply down in 2017 due to legislation and consequent debt (the [un]Fair Power Plan), but,
  • total costs for supply declined in 2017, although average unit cost was up slightly (as demand declined more)
  • nuclear supply was down as one unit (Darlington 2) was out of service for the entire year due to refurbishment, but the units remaining online largely took up the slack as Bruce Power had record output, as did the set of 9 units at Ontario Power Generation which operated during 2017, and
  • for the first year since the system operator reported on their system's wind output, in 2006, it reported a decline (albeit a very slight one)
I didn't wish to dwell on numbers in this post. During 2017 I learned some new data reporting tools which I put on on a site where I invite data-gluttons to learn the filters and views to generate the typical year-end summary statistics, such as the total annual biomass generation for the past decade.
I do wish, in this post, to combine commentary to statistics to demonstrate very good figures from one perspective can have bad implications from a broader perspective. This is particularly important to note as the reasons rates didn't rise sharply in 2017 aren't sustainable.

Monday, June 5, 2017

Ontario electricity: How we got to here

It is the best of times, it is the worst of times.

The best: over the first five months of 2017 the reporting from Ontario's system operator (the IESO) indicates less than 2 terawatt-hours (TWh) of electricity has been generated from natural gas fueled facilities, with the remainder of 59 TWh generated on the IESO system coming from near-zero greenhouse gas emission sources. Since April 2014 coal has not been burned to produce electricity in the province. Emissions intensity of generation over the first 5 months of 2017 is approximately 14 grams of CO2 equivalency per kilowatt-hour (g CO2 eq / kWh), which is particularly low for a jurisdiction receiving less than 30% of its generation from hydro-electric sources.

Some things will be viewed as good, or bad, depending on the perspective of the observer: the last two months demand of IESO supply has been lower than in any month since 1994. If "conservation" is good, it would seem Ontario has it good. Supply is plentiful. So plentiful the IESO reported 19 per cent of of "wind energy produced in the province" was dispatched down (curtailed) in 2016, and Ontario Power Generation (OPG) reported 16% more hydroelectric generation could have occurred if not for surplus supply. The numbers on the surplus in 2016 are noteworthy: 7.6 TWh curtailed equates with 5.5% of the 137 TWh "withdrawn from the high-voltage transmission system by Ontario loads", but a further 21.8 TWh was exported meaning total supply (including imports) was 21.5% more than those loads required.

Some things are now viewed as bad, that were previously viewed by some as good. Regulated Price Plans charging residential, farms and other small business consumers what the government had longed planned to have them paying are suddenly being cut steeply through a debt scheme to be paid off whenever down the line. In order to keep cost hikes in line with previous projections the government already had to abandon first the collection of a Debt Retirement Charge and then the provincial portion of the Harmonized Sales Tax - some feel the lower government revenues a negative.

I've written often on the causes of higher rates in Ontario. I am inspired to do so again by the uncovering of documentation from a previously hidden Integrated Power System Plan in 2011. Shawn-Patrick Stensil, of Greenpeace, acquired the documents through a long Freedom-of-Information (FOI) process.

This post examines 3 long-term plans' annual forecasts of Ontario's electricity supply mix, with a focus on the capacity mixes forecast for 2016 compared to the current actual supply composition.

The current situation is not accidental.

This is how we got to here

Sunday, October 23, 2016

Fixed: Ontario's electricity relationship with Quebec

Ontario's government, keen to appear responsive to public anger at electricity pricing, has announced an agreement to fix one aspect of the supply system currently working well.

Ontario and Quebec announced an electricity agreement guaranteeing Ontario 14 million megawatts-hours of imports from Quebec over the next 7 years. Compared to Ontario's other electricity contracts, this deal looks attractive at first glance. Looking closer the deal is less attractive,and putting the deal in the context of Ontario's move away from public power, at cost, to what was intended to be a competitive market system, it may be the most ridiculous contract of all.

The agreement, according to Ontario's press release, is for:
  1. energy capacity,
  2. trading electricity, and
  3. energy storage.
All 3 aspects of the agreement exist already, due to the realities of electricity supply and demand in the two provinces, and previous initiatives connecting the systems.

The capacity arrangement, securing rights to supply for peak demand hours, is technically convenient. Quebec has a very high winter peak demand, due to electric heating. They have a system designed to do that - but more capacity on the coldest days is desirable. Ontario's demand peak is usually in summer - and more capacity for that is desirable. Since April 2011 I've captured hourly intertie movements - and looking at each subsequent season's top 10 daily peak hours, its evident Ontario is a net importer from Quebec during the highest demand summer days, and usually an exporter during the highest demand winter days. While this relationship has existed, and would continue to exist, without an agreement, there are capacity reserve tests requirements enforced by the North American Electric Reliability Corporation (NERC), and this formal agreement should be useful in meeting those requirements.


Increased electricity ties with Quebec have long been recognized as having benefits. Significantly, late in 2006 an agreement was made to expand the connections between the two provinces by 1,250 megawatts, and the completion of the work allowed for greater trade by 2009.

Monday, June 20, 2016

OPG's application to hike nuclear power rates harms credibility

The average cost of power from Darlington nuclear units post-refurbishment is estimated to range between $72/MWh and $81 MWh, or 7 and 8 cents per kilowatt hour.
So announced the Ontario government in a January 11th, 2016 news release.
137 days later Ontario Power Generation (OPG) filed an "Payment Amount for Prescribed Generation Facilities" application with the Ontario Energy Board, asking for rates for supply from its nuclear generators to rise to $99/MWh by 2021.
data from OPB_Exl1-1-1_Att1_OPG_RevenueRequirement Work Form_20160527.xlsx filed at OEB
I find the rate application disheartening.

Anti-nuclear forces will find it very useful.

Wholesale reporter Keith Leslie wrote of "a whopping 69 per cent increase...over the next five years" with quotes from his standard go-to Jack Gibbons, who just days earlier had an editorial in the Toronto Star arguing for the closure of the nuclear reactors at Pickering using some of the same arguments he had discredited 2 years ago (by me in June, and by the IESO/OPA in October), and some other sound-bite emotive appeals developed in the 1970's. [1]

Which doesn't mean Pickering shouldn't be closed.

Having a better record with OPG's financial arguments than they themselves do, I feel obliged to see if OPG's management was just inept in formulating a rate hike that I suspect more likely to scuttle the refurbishment of Darlington's reactors than extend the life of Pickering's, so I'll explore the production and revenue requirement totals with some historical context, and review the poorly chosen "smoothed" option.
This rate hike request reveals some things about what OPG has become, and also reveals shortcomings of the Ontario Energy Board (OEB) in regulating Ontario's electricity sector.

Sunday, April 17, 2016

10700: Ontario's beastly number

Planning Ontario's electricity sector should have been a topic of interest when, on December 2nd 2015, the province's Auditor General included a chapter on Electricity Power System Planning in her annual report. The report received a lot of attention, but our power system planning process did not. The fall of the arbitrary, yet long-standing, 10700 megawatt target for non-hydroelectric renewable energy would indicate a return of professionalism in planning Ontario's electricity sector.

Before 10700 was the Integrated Power System Plan (IPSP) process.

The Liberal government, elected in the fall of 2003, had created the Ontario Power Authority (OPA) largely to develop an IPSP professionally, if not entirely independently. The process had, in its early stage, the OPA prepare supply mix advise for the Minister of Energy. Some notable aspects of the December 2005 advice:
  • Preference for renewable sources of energy...
  • Renewables, including wind, small hydro (waterpower) projects and hydro purchased from other provinces (referred to as “hydro imports” in the balance of this report), can provide a significant share of capacity and energy...
  • ... conservation and new renewable sources would more than meet all of Ontario’s growth in demand for electricity by 2025. This would not, however, replace the loss of capacity from the retirement of other supply sources...
  • Together, natural gas and renewable sources can replace coal generation...
I've added emphasis, but quoted from the OPA verbatim.
The OPA suggested to the Minister that by 2025 "renewables" be 15,500 megawatts (MW) - inclusive of about 8000 MW of existing hydro capacity and most likely the 1,250 MW increase in the Ontario-Quebec intertie capacity. [1]

Six months later, in June 2006, a Supply Mix Directive from the Minster tasked the OPA with the development of an IPSP (plan) including:
Increase Ontario's use of renewable energy such as hydroelectric, wind, solar, and biomass for electricity generation. The plan should ... increase the total capacity of renewable energy sources used in Ontario to 15,700 MW by 2025.
The IPSP final form, delivered August 29, 2008, planned for 16,164 MW of renewables by 2025: 10,768 MW of hydroelectric, 4,251 of wind, 656 of bioenergy and 488 MW of solar. [2]


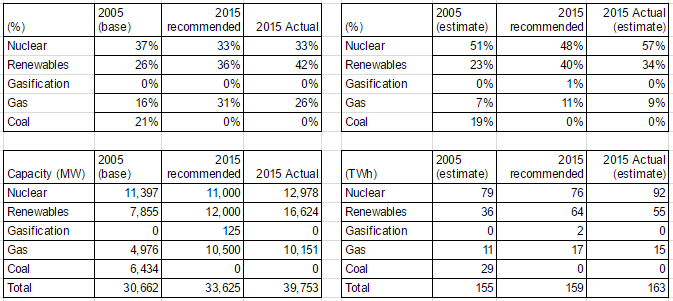
opa2005to2015actComp
Spreadsheet comparing OPA Supply Mix Advice from 2005 to estimated actual 2015 data.
1st posted in Reviewing a 2005 plan for Ontario’s electricity supply in 2015
19 days later, on September 18th 2008, a Minister of Energy and Infrastructure essentially killed 3 years of work with an unintelligible directive amending the 2006 Supply Mix directive.

Thursday, March 10, 2016

The cost of ending coal-fired generation, and renewables, in Ontario

Ontario stopped getting electricity from burning coal at the end of 2013. The coal exit is one element of Ontario's electricity system gathering attention from other jurisdictions, along with a very low greenhouse gas emissions intensity, the fastest growing (and possibly now the highest) rates in continental North America, and a high level of resistance to new generation from local residents. It might be logical for outsiders to associate the steep rise in the price of electricity as the cost of getting off coal, but that has not been the major factor pushing up rates.

Bruce Sharp, an energy analyst I greatly admire, recently produced Ontario Electricity - the Cost of Coal Replacement, which put some numbers up against an Ontario government document on The End of Coal. That document is not the proper starting point for evaluating the cost of ending coal, but Sharp's methodology for pricing provides a useful foundation to build an analysis upon.

table from Bruce Sharp's Ontario Electricity - the Cost of Coal Replacement

4,000 megawatts of wind, and 1,500 of solar, were not part of the plan to replace coal. I've previously demonstrated added natural gas and nuclear generators compensated for the removal of the coal-fired power plants.
Graphic from January 2013 post - data in this spreadsheet
Upon reflection, I think the proper starting point to evaluate the cost of exiting coal is June, 2005 - and it can include some wind. The elimination of coal was a 2002 recommendation of  an "all-party Select Committee on Alternative Fuel Sources", carried in the platforms of the three major parties into the 2003 election. That election was won by the party promising to eliminate coal by 2007 (not 2015 as the all party committee had recommended) - but they weren't succeeding in that goal, so in 2005 they released more specific plans described in this press release:

Friday, February 12, 2016

Eating wind: Carbon capped opportunity Part 2

Reading Rooftop coal: Carbon capped opportunity Part 1 will benefit readers of this post

There's a message being spread about Ontario that the expensive, but low carbon emission, electricity it produces will soon be worth big bucks due to the proposed Clean Power Plan in the United States - and trading of emissions. This was implied by one member of the Climate Action Group on television recently (I wrote on the program), and quickly expanded upon in into an article in The Toronto Star:
... the country’s power sector is prepping for a dramatic increase in U.S. demand for clean electricity.
Action on climate change is the reason — more specifically, U.S. President Barack Obama’s Clean Power Plan, which aims to slash carbon dioxide emissions from power plants by a third by 2030.
The plan is expected to triple the flow of Canadian electricity into Midwestern and northeastern border states, part of a broader U.S. effort to comply with the international climate obligations that 196 countries agreed to in Paris.
...
The North American Electric Reliability Corporation [NERC], which monitors and regulates grid stability in Canada and the U.S., estimated in a report last April that net Canadian electricity exports under the Clean Power Plan could grow three-fold between 2020 and 2030 as demand for renewable power grows in states such as Ohio, Michigan, New York and jurisdictions in New England.
Here we have the agreement from Paris and the U.S. Clean Power Plan discussed, so I'll briefly discuss each to communicate the value for Canada, and particularly Ontario, is limited - but an opportunity does exist.

The most relevant quote for the Paris deal comes from The New York Times' Coral Davenport back in August 2014:
...President Obama’s climate negotiators are devising what they call a “politically binding” deal that would “name and shame” countries into cutting their emissions.
...Countries would be legally required to enact domestic climate change policies — but would voluntarily pledge to specific levels of emissions cuts...
That "name and shame" strategy was advanced in Paris, primarily because the President lacked the ability to have Congress pass anything legally binding. Countries provide plans for reducing emissions, and if they don't achieve them they will be mocked by countries that are achieving their goals, should there be any.

The U.S. Clean Power Plan, if it gets enacted, will offer states a couple of methods to comply with individual emissions targets based on a subset of generators operating in the states in 2012 (I'd need to check in the volumes of text to confirm the base year) - the subset exclude generators without emissions in service prior to 2013 (most notably nuclear); it therefore basically includes almost exclusively emitting facilities.
States can target either emissions intensity, getting facilities to an average of ~20% below the intensity level of the 2012 base year (so replace coal with gas, of augment coal with wind, etc.), or they can just reduce their emissions by the requisite amount (it varies by state). Those sound the same, but the first option could actually see increased emissions. Illinois, for instance, could likely replace older nuclear units with natural gas generators and easily meet clean power plan targets by doing so.
Emissions reductions can come in state or not - by power purchase agreements with facilities outside of the state, or through the trading of cap space (such as through clean energy certificates).

How does this impact Ontario?
___

The North American Electric Reliability Corporation [NERC] reference in the Toronto Star article is probably Potential Reliability Impacts of EPA’s Proposed Clean Power Plan: Phase I, which does show a forecast where:
"Canada exports three times more power to the United States, mainly NPCC and MISO North."
NPCC is the Northeast Power Coordinating Council and it includes Canadian provinces/systems east of Manitoba as well as the New England and New York system operator areas (NYISO and ISONE).

The NPCC jurisdictions don't import much more juice in the NERC work:
graphically edited to most relevant data from NERC "Potential Reliability Impacts of EPA's Proposed Clean Power Plan
The "MW Interchanges No CPP" indicates, for Canada, net exports of 5,461 megawatts on average if the Clean Power Plan doesn't come into force, which works out to an annual total of about 48 terawatt-hours (TWh), and that is the average that actually occurred from 2012-2014. The best case (State level application of the Clean Power Plan) offers an export opportunity into New York and New England systems of another 691 megawatts on average, but that's little more than Ontario wasted in 2014 as generators reportedly curtailed an average of ~550 megawatts (by way of annual totals of 376 thousand MWh of wind, 1.2157 million MWh of nuclear and 3.2 million MWh of hydro-electric power). The NERC document that enthused Tyler Hamilton writing in the Star doesn't offer much hope for the U.S. northeast bailing Ontario out of its over-supply.

Rooftop coal: Carbon capped opportunity Part 1

Big topics are converging as Toronto's spinners, enthused by a new power in Ottawa, work a yarn to justify raising revenue for the government and to gloss over the massive waste in the electricity sector since 2008.
This post is longer than usual, so it is presented in two parts. My intent is to discourage contracting more excess electricity supply in Ontario, and to demonstrate a limited opportunity to steeply reduce losses on existing contracts

Climate change has been called a wicked problem, but that's usually ignored when tidy, if false, solutions get presented.
Two of those solutions are Cap and Trade everywhere, which is of particular interest to Ontarians now, and the U.S. Clean Power Plan -which Ontarians are getting told they might benefit from.

The editorial board of the New York Times has declared Proof That a Price on Carbon Works:
Lawmakers who oppose taking action to lower greenhouse gas emissions by putting a price on carbon often argue that doing so would hurt businesses and consumers. But the energy policies adopted by some American states and Canadian provinces demonstrate that those arguments are simply unfounded.
Around the world, nearly 40 nations, including the 28-member European Union, and many smaller jurisdictions are engaged in some form of carbon pricing. In this hemisphere, British Columbia, Quebec, California and nine Northeastern states have raised the cost of burning fossil fuels without damaging the economy. Alberta, Canada’s biggest oil and gas producer, and Ontario have said they will adopt similar policies.
...British Columbia, which is home to 4.7 million people, has placed the highest price on emissions in North America, taxing a ton of carbon emitted at 30 Canadian dollars, or about $21. By comparison, emission permits in California and Quebec are trading at about $13 a ton. And permits sold for $7.50 a ton in a December auction in the Northeastern trading system known as the Regional Greenhouse Gas Initiative. That system covers emissions from power plants in nine states that include Connecticut, New York and Massachusetts.
These actions deserve applause. But their real value may lie in providing a template for the rest of the world.
The New York Times editorial board is, with one exception, citing actions that have not taken place yet as evidence contrary arguments "are simply unfounded." Is there a topic outside of global warming/greenhouse gas emissions that inspires such intellectual laziness? [1]

Two Cap and Trade initiatives cited in the editorial are the California centred Western Climate Initiative (WCI) and the U.S. northeast's Regional Greenhouse Gas Initiative (RGGI).

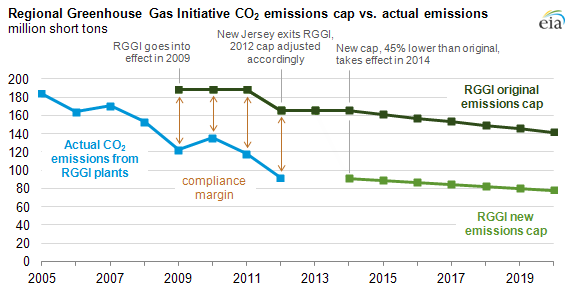
A couple of years ago the U.S. Energy Information Administration (EIA) wrote on the RGGI. From the graphic I guess one could conclude it had been super super great as emissions were far below cap - or one might think the cap was set far too high, particularly if one reflected on why cap space continued to be held by the emitters allocated the emissions allotment (and/or traders), and not sold to somebody wanting to emit.


I thought, examining this graphic, it looked like the new lower cap was still likely to be above "business as usual" emissions, particularly as similar banked credits have been a source of contention in the European Union's Emissions Trading System (EU ETS) - so, on twitter, I asked the EIA, and was politely told who to contact for more information - but I wasn't looking for more information, I was looking for a firm "no", and not receiving one, I was not inspired to pursue study of the RGGI scheme further.

Thursday, October 30, 2014

A Carbon Tax for Ontario, today

There are lots of opinions about how to reduce global emissions of greenhouse gases. A carbon tax is frequently presented as the preferred choice of most economists, and it is a carbon tax that Ontario is ideally suited to introduce to its electricity sector. There need be no immediate costs to most consumers in introducing a tax which promises significant benefits.

A carbon tax could fulfil a political need, both domestically and internationally, to do something that is perceived as being about reducing greenhouse gas emissions. Every government wishes to present itself as active in reducing emissions. For the incumbent  Ontario government that will be important as the province is planned to enter a period of increasing emissions in its electricity sector. More significantly, Ontario could exert an influence beyond it's borders by introducing a very significant carbon tax in its electricity sector, and it could do so painlessly.

Figure 1: historical and forecast electricity costs
Since 2005 Ontario has recovered the cost of its electricity supply not simply through market rates, but through an additional "global adjustment" charge calculated to capture supply costs the market does not. That charge has been above $5 billion a year since 2010 and is anticipated to remain so for the next decade. Currently the global adjustment consists primarily of the costs of procuring supply less the money recovered from the sale of the supply to consumers.

One very contentious aspect of carbon taxation is what should be done with revenues. That should not be debatable in Ontario's electricity sector, because the revenues could simply be used to decrease the global adjustment charges currently payable by Ontario's consumers.

Thursday, October 4, 2012

Bunking with Gipe: about Germany's Electricity Revolution

Paul Gipe is out with a particularly misleading post:  German Coal-Fired Generation of Electricity Falls While Renewable Generation Rises: Debunking Another Myth about Germany's Electricity Revolution:
The latest talking point is that Germany is burning more coal than ever because of all the intermittent renewables that have been added to the system.
So, let's have some fun with numbers and separate fact from fiction.
First, the source. All the data I'll use comes from the Work Group on the German Energy Balance (Arbeitsgemeinschaft Energiebilanzen) and can be downloaded from their web site.
Let's not have some fun with numbers.
Let's do some honest work with them instead.

The first point would be including natural gas and reporting on all fossil fuels in any analysis.  Using the AGEB data referenced by Gipe, the graph shows remarkably little movement - the totals for 1990 and 2010 are almost identical.
These figures don't capture an entire 12 months of data since March 2011, when German took offline a number of nuclear reactors.

Monday, August 6, 2012

Vampire Turbines In July

I recently read an entry on Wayne Gulden's Wind Farm Realties website reviewing some figures for the Vestas V82 - 1.65MW capacity industrial wind turbine. The statement that stuck with me was:
... when the wind doesn’t get above 3.5 m/s – typically there’s a MINUS 50kw of production. This is power that must be supplied from the grid just to keep the turbine in business. And 50kw seems to be what the turbine uses to stay alive in good weather. In the winter it gets slightly higher – the highest negative numbers were in the 80 kw range.
I decided to investigate the performance of an industrial wind turbine project in Ontario comprised of 110 of the Vestas V82 turbines; Enbridge's Underwood turbines in Bruce County.

110 turbines potentially each drawing 50kW means that at times when all Enbridge's turbines are still, the draw would be ~5.5MW.  In the parlance of the Ministry of Energy, and the renewables lobby, a draw of 5.5 MW is enough to prevent power being provided to over 4000 homes.

In Ontario, we know that wind is least productive in July - so the topic of how much "parasitic" load is present when turbines are unproductive is particularly relevant here.

Monday, June 18, 2012

Wind 'em Up Day: Spin Baby Spin

Friday was dubbed "Global Wind Day"

In Ontario, that meant some rather predictable things - like installations that had been producing output for half a year had ceremonies to officially baptize them as open.  These included the largish Greenwich wind farm Enbridge has been operating near Thunder Bay; and David Suzuki slunk onto Manitoulin Island, with Ontario's current Minister of Energy, to open the 4MW Mother Earth Renewable Energy wind project.   What is also now expected, and disturbing, is the politicization of the bureaucracy compelled to join in with the suspect industry's agenda; all reported, as if news, in the mainstream, media.

The Environmental Registry posted 5 notices on Global Wind Day including 2 renewable energy certificates approving Samsung/Korean Consortium wind projects, with a third awarding the REC for their 'Grand Renewable' solar project.  The sudden flood of activity on the Samsung file followed John Spears' article in the Star pretending a need for urgent action on moving the Samsung projects forward.

Wednesday, May 23, 2012

Green Is The Old White

News last week that The European Parliament cancelled their delegation to the UN's Rio+20 summit on sustainable development.  The reason being that the brutish Brazilians didn't know how to host a conference properly:
“The Brazilian government should have taken action to avoid hotels abusing their position. That's also part of the responsibility of hosting such a large conference,” said Dutch Liberal MEP Gerben-Jan Gerbrandy, who was to lead the delegation.
The first Earth Summit, hosted in Rio de Janeiro in 1992 - with Maurice Strong as Conference Secretary General, is remembered for creating a couple of notable things, including; the United Nations Framework Convention on Climate Change, the Convention on Biological Diversity, and the fabled Agenda 21.
It is not remembered for the cost of hotels.

Wednesday, March 7, 2012

Wind Is Not Reducing Emissions

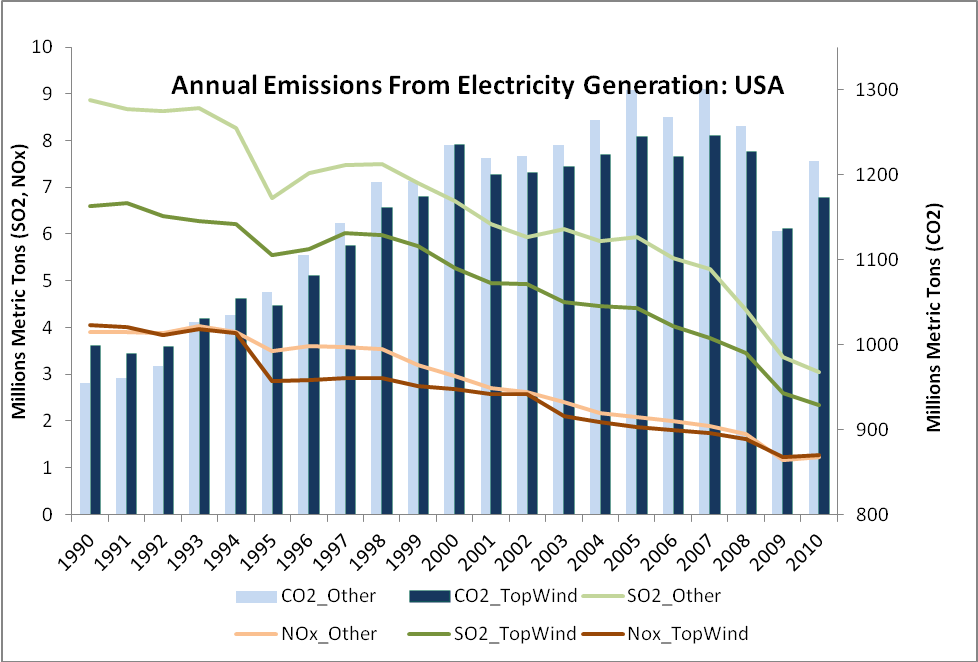
Top Wind States are the 20 states with over 930 GWh from wind, in 2010
Clearsky Advisors put out an article, a couple of months ago, built on US Energy Information Administration (EIA) data, comparing rate increases between 2005-2010, and total renewable energy capacity ‘of solar PV and wind.’ The same company put out a report in 2010 to claim spending huge sums on solar was great because it took all kinds of hours of work to create a Watt that way. That report went so well in 2011 the wind industry paid them to do the same. That report still gets trotted out by the ‘green’ lobby as proof of something or other whenever they wish to obfuscate - which, in Ontario (and BC and Alberta) they are doing this week to prevent rural governments from managing rural jurisdictions (only in Ontario).

Tuesday, January 17, 2012

A Sober look at Ontario’s 2011 Electricity Figures

"He uses statistics as a drunken man uses lamp-posts...for support rather than illumination."
                                    -Andrew Lang (1844-1912) Scottish poet, novelist and literary critic


Ontario’s Independent Electricity System Operator (IESO) issued a news release on January 6th titled,“Composition of Ontario’s Electricity Supply Mix Continues to Change: Consumer Response Supports Reliability.” The introduction posits there were three trends highlighted in the data; “increasing production from renewable resources, reduced dependence on coal-fired units, and a more active role for consumers in managing their consumption.”   Not exactly the 3 trends I'd look for
  • The 'customers' most active in curtailing peak demand are businesses, as Parker Gallant and I demonstrated in a recent article. Many of them pitch in by closing up altogether;
  • Use of coal-fired generation is reduced because the periods we need it are down, but at peak demand we relied on coal-fired generation (I wrote on that here);
  • There is no trend to increasing production from renewables in the IESO data.
There is a brief uptick. From only the data presented by the IESO, summing up hydro and wind the numbers go from 39.7 TWh in 2008 to 40.4TWh in 2009, 33.5TWh in 2010, and then we have a singular point as an uptick in 2011, to 37.2TWh. While up on a dry 2010, the total renewables figure is unimpressive against a longer trend. In the past 22 years, renewables have infrequently produced less output than in 2011.

Tuesday, December 13, 2011

Kyoto a no-go: Canada exits

There's a lot of press, and commentary, on Canada's long-anticipated withdrawal from the Kyoto Protocol.
I've visited the International Energy Agency (IEA) site to grab a spreadsheet of CO2 Emissions from fuel combustion (the bulk of emissions), and done a couple of brief calculations to develop illustrations of why Canada exited Kyoto, and when we fell behind on our targets.

The Kyoto Protocol was signed in December of 1997.  It set a base year of 1990 - some would say because of the skill of negotiators from countries that didn't have growing GHG emission between 1990 and December 1997.  Especially countries with recovering eastern bloc ecosystems.

Thursday, November 17, 2011

Reviewing Ontario's Feed-In Tariff: Part 2


The current feed-in tariff (FiT) review in Ontario provides an excuse to explore some larger topics - like markets, efficiency, climate change and polices intended to lower emissions. FiT programs will drive up the price of electricity which threatens to reduce the movement of energy consumption towards increased use of electricity - a necessity in the eyes of many if overall carbon emissions are to be meaningfully reduced. FiTs, especially those offered with protectionist requirements, discourage trade in electricity, and that, in turn, further reduces efficiency and, therefore, affordability.

The premise that increased electricity is necessary for a low-carbon world has been repeatedly emphasized this year, including in reports on reducing greenhouse gas (GHG) emissions in California, and even more recently in a report, “Scottish Energy 2020?”, put out by the Institution of Mechanical Engineers.  That report noted, “Electricity is actually projected to be the smallest component of Scotland’s energy demand (heat and transport energy being greater)...”  

That sent me to the figures at the back of Part 3 of Canada’s latest (2009) National Inventory Report, to calculate per capita emissions for 3 categories with large residential components.   The resulting graphic shows per capita emissions in Ontario and Quebec (‘Electricity and Heat’ is almost entirely electricity in both provinces, as the ‘heat’ referred to here is primarily the H in CHP - which is essentially absent in these provinces).  I’ve shown emissions from light vehicles, including light trucks.   Most are aware of Quebec’s hydroelectric capacity, but I’m not sure many understand the implications of heating with electricity.  In Ontario, 2011 is likely to see more emissions from heating than from all electricity generation (and both will be dwarfed by the use of light vehicles).