I have updated the weekly reporting to show the week of March 21 - March 27.
The news is in Hour 21(9pm) of Monday the 26th, which saw Ontario importing more electricity than it was exporting. That's the first hour of 2012 that we have been a net importer.
Demand was down from last year (by about 1900MW per hour!), negative pricing occurred frequently, and steam bypass at Bruce B units not only occurred, but was sustained for days.

Cold Air: Analysis and commentary on energy, environment, and politics
Friday, March 30, 2012
Wednesday, March 28, 2012
At Any Price: Wind as Negative Load, Not Generation
If wind is treated as ‘must take’ then it ought to be treated as negative load. The net load for the schedulable generators is then
Net = Actual – Wind

Baseload therefore refers, initially, to demand. The first graph shows baseload as the minimum daily Ontario demand. Between 2005, and 2011, the minimum dropped -on average 1574MW. That, coincidentally, is about the capacity of nuclear supply due to return as Bruce 1 and 2 return to service (I think the contracts were negotiated in 2005).
At any price: Reviewing Ontario's FIT review.
Last week the Ontario government rushed out FIT review. The review was reported to have been with the minister only 3 days, but that was enough to release it the same day the Opposition Leader's bill to abolish the program was voted on, and defeated, in the provincial legislature. That was a very quick turnaround for a ministry that has been sitting on the Integrated Power System Plan submitted by the same body - the Ontario Power Authority (OPA) - prior to last fall's election.
I disagree with the FIT program for a number of reasons - economic, political/social, and environmental (reasons have been explored in previous blog posts one, two, and call this three). I'll again briefly review how the program increases pricing, how it kills jobs, and how it can only increases emissions. I'll also look at the supporters of the policy, and what they have in common that enables them to argue an unsubstantiated positions successfully.
I disagree with the FIT program for a number of reasons - economic, political/social, and environmental (reasons have been explored in previous blog posts one, two, and call this three). I'll again briefly review how the program increases pricing, how it kills jobs, and how it can only increases emissions. I'll also look at the supporters of the policy, and what they have in common that enables them to argue an unsubstantiated positions successfully.
Wednesday, March 21, 2012
Ontario's Sick Electricity Sector Symptom of the Week: Paying gas generators not to generate
It will be a couple of days until I'll update the weekly reporting, but the generator data is set, and much of the pricing data. In week 11 (March 14th - 20th) the frequency of steam bypass maneuvers at Bruce B increased, but we also see another supply curtailment method used over the weekend - the idling of non-utility generators (NUGs). Over the weekend Ontario appears to have been simultaneously paying one of Canada's power giants, TransAlta, not to produce with natural gas at co-generation facilities while purchasing the output from their intermittently generating wind properties.
.png)
Curtailment of the NUGs is usually for a number of days. One of the reasons is contracts that predate the current electricity system's structure. The contracts were with Ontario Hydro, and when that ceased to exist they were transferred to the Ontario Electricity Financial Corporation (OEFC). Operationally, that means the shutdowns need to be scheduled in advance. In this instance, the surplus baseload generation (SBG) reporting indicated far too much supply over the weekend, and NUG's were curtailed, by about the same wattage as one of Pickering's units, from late Friday night to the demand ramp up Monday morning.
NUG contracts are private, but estimated above $100/MWh.
Friday, March 16, 2012
Nuclear Units Sidelined as Demand, and Price, Drop: Week 10 Report
Week 10 reporting, for Wednesday March 7 - Tuesday March 13, has replaced week 9's figures in my version of weekly reporting.
The record low pricing for a single day occurred on Sunday, and the weighted average price for the week, $11.74, was the lowest weekly average price since 2009.
Predictably, the depressed pricing corresponded to a record week for wind output.
The record low pricing for a single day occurred on Sunday, and the weighted average price for the week, $11.74, was the lowest weekly average price since 2009.
Predictably, the depressed pricing corresponded to a record week for wind output.
Thursday, March 15, 2012
The Lies of March: ENGO’s Coordinated Dishonesty Props up McGuinty
By the end of 2014, Ontario will be the first jurisdiction in the world to replace dirty coal-fired generation with more sustainable alternatives such as wind, solar and bioenergy -- the equivalent of taking seven million cars off the road. This is the single largest climate change initiative being undertaken in North America and will lead to savings of $4.4 billion a year in health care, environmental and financial costs.-“Ontario Shutting Down Two More Coal Units” news release, December 1, 2011
This is one of the more recent quotes deliberately attributable to the Ontario government. Most statements regarding coal have their foundation in a document from April 2005, “Cost Benefit Analysis: Replacing Ontario’s Coal-Fired Electricity Generation,” which was prepared by DSS Management consultants. The quoted news release displays neither an understanding of the document, nor an attempt at understanding. The figure above includes the energy based on 2004 generation and costs - if if were possible to replace 2004’s roughly 27.6TWh of coal generation with wind turbine output, contracted at $135/MWh, the cost would be $3.725 billion, plus the significant environmental and heath costs of that source. There are no savings even if the report is accepted as gospel.
The figure people attempting honesty quote are found in Table I-4 of the report, and that figure is roughly $3 billion a year in ‘Health Damages.’
Tuesday, March 13, 2012
Spooning for McGuinty - battling an Act of Hudak
Ontario PC leader Tim Hudak introduced a bill to eliminate the Feed-in Tariff (FIT) Program and restore local control over local issues; the "The Affordable Energy and Restoration of Local Decision Making Act." It must be good, judging by the weakness of the arguments against it. The Canadian Wind Energy Association (CanWEA) issued a news release titled "Proposed Act would create significant economic uncertainty, put local jobs at risk." If the field of economics had Razzie awards, the CanWEA release would be in it's hall of shame.
Monday, March 12, 2012
Ontario's Electricity Price Hits Record Low
This post has been updated following posting of IESO Daily Market Summary
.png) |
| Based on available hourly data - all are estimates |
The previous record, $-17.54, was Sunday, August, 28, 2011, and many of the characteristics of that debacle existed on the latest Sunday too - the main one seeming to be the disinterest in external markets in allowing Ontario to dump excess production - at any price.
Friday, March 9, 2012
Wind Pushes Out Nuclear: Week 9 Reporting
The week 9 reporting, for Wednesday February 29 - Tuesday March 6, is now posted at the IESO site, and I have updated my version of weekly reporting too. The overall weekly demand and pricing figures show the same trends as the past several weeks have shown, but looking closer at the data the developing break-up of Ontario's electricity plan is indicated.
Wednesday, March 7, 2012
Wind Is Not Reducing Emissions
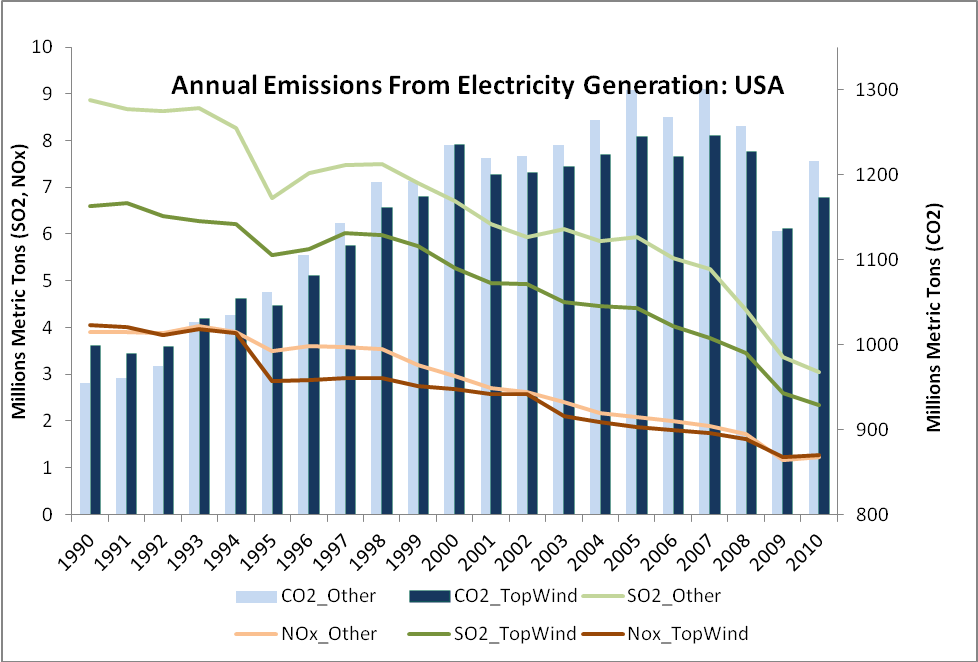 |
| Top Wind States are the 20 states with over 930 GWh from wind, in 2010 |
Sunday, March 4, 2012
Class A Absurdity
My previous blog entry described the government's creation of a separate class of customer, which I put in the context of the need to get electricity pricing for industry competitive with other jurisdictions. I carefully referred to that methodology as 'absurd.' Today a review of why it is absurd, why it is bad that it is absurd, and why Ontario is worse off because absurd is tolerable in our electricity system.
The creation of the Class A customer, one with "average monthly peak demand in excess of 5 MW," and the methodology for setting their rates - " the five hours, occurring on different days, in which the greatest number of Megawatts (MW) of electricity were withdrawn by all market participants" - are set out in the Environmental Registry entry for the change to the global adjustment mechanism:
The creation of the Class A customer, one with "average monthly peak demand in excess of 5 MW," and the methodology for setting their rates - " the five hours, occurring on different days, in which the greatest number of Megawatts (MW) of electricity were withdrawn by all market participants" - are set out in the Environmental Registry entry for the change to the global adjustment mechanism:
The proposed changes to the global adjustment mechanism would provide large consumers with a strong incentive to reduce consumption at critical times, consistent with the government’s commitment to creating a culture of conservation. By reducing peak demand, the proposal is expected to avoid costly investments in new peaking generation resources and imports of electricity from jurisdictions reliant on coal-fired generation.
Absurdity #1: There is an Environmental Registry entry for the change (greenwashing).
Saturday, March 3, 2012
Demand Destruction: Economic Reality And Ontario's Electricity Policy
“The findings reflect reasonably consistent patterns of price response. At the national level, electricity price elasticity of -0.13 in the short run and -0.42 in the long run have been estimated.”I first quoted that sentence, from a 2010 Electric Power Research Institute (EPRI) analysis, in June of last year, in an article related to a bureaucrat's report. Recently, another bureaucrat of sort, Don Drummond, released a report that offered some advice that provides a timely excuse to revisit the price elasticity of demand with respect to electricity.
.png) |
| Statistics Canada CANSIM data fromTable 329-0073 |
The price elasticity is the figure computed by dividing the change in demand by the change in price - if demand drops 10% when the price rises by 100% (doubles), the measurement is -0.1, which is a frequently noted figure for electricity. The number would vary along the price/demand curve, so all figures can only be guides. The EPRI study noted short term as; "a time frame of less than three to five years, during which consumers do not have time to make investments in new capital stock." In clear terms a price increase would have a greater impact in the longer term, when consumers have time to make operational decisions based on the new price levels.
Friday, March 2, 2012
Week 8 Update: Hockey Night in Ontario
The weekly report has been updated to display week 8.
Same outcomes again, with demand down, Hourly Ontario Energy Price (HOEP) off by about a third and moving in a narrow range.
For the second week the highest price of the week was a spike at 7pm Saturday, as demand went up as wind production dropped. It seems something is both attracting television viewers and sucking the air out of sections of the province.
Subscribe to:
Posts (Atom)