Saturday, October 22, 2022

Ontario Residential Electricity Rates are dropping. Bills aren't.

The Ontario Energy Board (OEB) released Regulated Price Plan (RPP) rates for the next 12 months, and they're down 10% from the current period. Other changes were not as clear from the material published along with the new rates, which I've come to realize is necessary for residential consumers to understand that their bills will change very little. I was waiting to see what the mainstream media would publish regarding the steep, and internationally rather unique, decline in rates, but I've seen nothing - which is somewhat of a blessing given the poverty of understanding demonstrated in recent reporting on Ontario electricity. I'll explain what is happening to rates, why they're dropping for one category of consumer, why it won't change individuals' bills, and the impact on other categories of consumers from recent changes in the so-called market's pricing.

I've added summary columns to the OEB's presentation of rate changes in the following tables, to demonstrate the reduction is rates. For those hoping to find information of which rate plan is best for them I'll point to my work 2 years ago as there's no real change in the mechanics: if your usage is primarily in the lower threshold of the tiered pricing plan, use that plan - if it's mostly in the upper tier, stay with the default time-of-use (TOU) rate plan.

Wednesday, May 25, 2022

Refurbish Pickering Nuclear Generating Station

I was approached some time ago about supporting the refurbishment of the Pickering Nuclear Generating Station (PNGS). While I tried to be positive in offering to support proponents with data work, I didn’t add my name to the campaign primarily because, in addition to supporting nuclear, I try to support consumers. Things change, and the argument for a full refurbishment of reactors at PNGS has recently grown much stronger.

When I began this blog back in 2010 I pushed back against increasing electricity supply and the enormous costs unnecessary expansion was having on consumers, despite over half a century of declining growth rates in demand that had become no growth at all. In hindsight this was correct, and consumers benefited from the analysis. While Ontario has been awash in surplus supply for most of the ensuing 12 years, 2010’s desire to contract 10,700 MW of “clean, renewable energy from wind, solar and bioenergy” was never realized and today we have about 3,000 MW less than that under contract. For perspective, 3000 MW of wind at the prices the government in 2010 was contracting would have added about $25 billion in cost to Ontario’s consumers (over 20 years).

‘Renewables’ were not the only supply options being rolled back after 2010-2011. The “Oakville Generating Station” was contracted in 2009 (eventually built as the Napanee Generating Station), and that remains the last procurement initiating a major gas-fired generation station. Ontario Power Generation (OPG) not only abandoned plans for new nuclear builds but also for the refurbishment of the Pickering B, opting instead for life extension options on a far smaller scale.

I’ve long been unenthusiastic about all potential new generation which, in hindsight, was marked by high pricing due to unnecessary contracting, stagnant demand and excess generation. Including nuclear.

I shared my opinion on a supply mix for the province over 11 years ago:
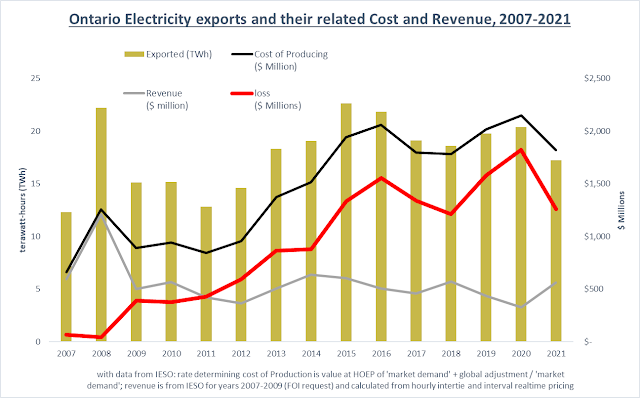
The [Ontario Power Authority] is likely to determine that 8 Bruce units, and 4 Darlington units, will be able to supply 50%, of total electricity generation necessary to meet demand within Ontario… I would suggest the minister revise the wording of the directive to nuclear generation should be targeted to account to meet 50% of Ontario Demand. Looking back on statistics back to 1990, that is the level above which we become major exporters of electricity
During the next Ontario electricity planning cycle, in 2013, I developed planning tools to test different mixes under different assumptions on productivity and pricing. Again I found the most economic lower-emission scenario was the 10,000 megawatts (MW) of refurbished nuclear capacity (comprised of 8 Bruce units and 4 Darlington ones). In one scenario I’d run based on stagnant supply, adding another 2,000 MW of nuclear (roughly the combined capacity of the 4 Pickering B units) reduced gas use, and emissions, but about half the added nuclear would have been wasted, dumped or displacing other trivial emission supply.

A lot has changed for modeling since 2013: I would use much different pricing, I’d have to adjust my expectations of output from industrial wind turbines (they’re bigger and have higher capacity factors), sharply reduce solar pricing, review storage aspects, etc. But the biggest issue would be forecasting demand, and it is there that I’ve been convinced the tide is turning and the long period of stagnant electricity consumption in the province is ending.

Wednesday, May 11, 2022

Fake news and professional planning


As somebody who has observed, measured, critiqued and discussed Ontario’s electricity sector for a dozen years I feel compelled to discuss a couple of harmfully poor articles that have recently appeared in Toronto’s sleaziest newspapers.
Retiring Ontario’s natural gas-fired power plants would be cheaper than official estimates released last fall, critics say, adding that they believe the government suppressed the publication of modelled scenarios that would have supported closing the carbon-intensive facilities.
That begins an article that appeared in The Globe and Mail last month, ascribed to a Matthew McClearn who the paper’s website comically describes as, “an investigative reporter and data journalist with The Globe and Mail's Energy, Natural Resources and Environment Team.” McClean’s article, “Documents raise questions about costs to retire Ontario’s natural gas power plants”, quotes a single critic from his “investigation”. That critic is Jack Gibbons.

I’ll admit that Jack Gibbons is a critic. As am I. I’ve also thought of him as a self-promoting snake, but realize now he’s more of a chameleon. In 1998 Gibbons’ “Ontario Clean Air Alliance” (OCAA) was promoting gas as a replacement for coal, as it continued to do even beyond 2009 when Gibbons was advocating for the Oakville (gas-fired) Generating Station - which turned out to be the last major gas-fueled new-build generator contracted in the province. Emissions today are far lower than under any of the scenarios the OCAA lobbied for during it’s first decade-and-a-half of existence and, simply put, when the OCAA called for a gas phase-out it called for something that began while they were advocating for new gas plants. In the past couple of years the aging OCAA members seem to have yearned for the years they received attention and collected ignorant municipal councillors to sign on to a campaign putting an end date on gas-fired generation.
... we recommend that the Government of Ontario take the following actions to achieve: i) a complete gas plant phaseout by 2030; and ii) an interim 2.5 million tonne per year cap on the gas plants’ GHG pollution as soon as possible. - OCAA Feb. 2021
The OCAA gas phase-out campaign steals from the strategies of the McGuinty Liberals in Ontario, who seized the coal phase-out issue as their own in the election of 2003 by promising to end coal 7 years earlier than the other parties planned - which they subsequently didn’t, but still credited for the policy. No new-build gas generator has been initiated with a contract since 2009 in Ontario. The long-term energy plan of 2013 invented a "planned flexibility" category, which had exactly the same attributes as simple cycle gas turbines specifically because it was non palpable by that time. In response to the OCAA campaign to be seen as against what they promoted for well over a decade the Minister of Energy issued a moratorium on procuring what hadn't been procured for the past dozen years.

Saturday, February 19, 2022

Ontario Electricity Exports: losses, benefits, and transmission charges

In 2021 Ontario’s electricity market sold exported electricity for $1.25 billion dollars less than Ontarians paid to have it supplied. That amount is calculated with a methodology I described one year ago. 2021’s $1.25 billion loss is an improvement on 5 of the past 6 years, and $563 million better than we fared in 2020.

Others look at exports differently. Today we visit the murky world of the Ontario Energy Board (OEB) as it deals with a transmission charge for exports - which is where we find the IESO providing expert opinion.

A quick review of my work estimating losses on exports for those who haven’t memorized last year’s article: I copied (or attempted to) the methodology of the Office of the Auditor General in its 2015 annual report, which tallied up total system cost and usage to find an average cost of supply, takes revenues and volumes of exports, and does the math on how much lower the overall cost of exports was at the rate exporters paid than if they’d paid the average rate.

If I had to present a one-sentence hit on that I’d borrow from professionals on the wording and put in my calculated figures:

exports of electricity from Ontario have contributed between $1.2 and $1.8 billion of costs annually to Ontario’s Global Adjustment Charges between 2017 and 2020

Sunday, February 13, 2022

2021 Ontario Electricity Data Summary and discussion

Ontario’s system operator (IESO) was tardy in publishing its “year in review” summary - and I was content to delay mine until their’s appeared. Before diving into the analysis I want to note the some challenges facing the sector as they’ve emerged in my media world:
  • the role of electricity in the broader energy sector;
  • the role of natural gas in the electricity sector;
  • decarbonization;
  • the role of Quebec supply in Ontario’s electricity mix;
  • the role of pricing to encourage electrification of transportation;
  • the role of nuclear and desirability of refurbishing Pickering B,
  • the role of storage,
  • the future supply mix,
  • pricing policies to shift consumption to periods of excess supply.
An annual analysis provides metrics that have utility, but it should be kept in mind this summary level of analysis has limitations. I’ll summarize annual statistics for not only 2021 but also for the years from 2014-2020 to give a perspective on where we were as well as where we are.

If you follow me on Twitter you may have seen the first numbers in the IESO’s summary, albeit in different units, days before the IESO posted them. Whereas the IESO posts these separately I’ll show the past 8 years here: