Showing posts with label curtailment. Show all posts

Thursday, March 7, 2019

Available low-cost electricity not utilized in Ontario

All figures are estimated (view in workbook)

In preparing my previous post I created a graphic posted separately on Facebook and Twitter. The graphic got more views than the post I edited it out of.

Comments on the original graphic included thoughts from the "electrify everything" perspective. I responded with too much caution, noting shrinking supply. Having given topic some more thought, I've added dumped exports as supply that has been available to Ontarians over the past years, on top of curtailed potential supply and under-utilized gas generators. In this post I hope to provide some context to the graphic, and show why coming changes in supply don't present a challenge for meeting Ontario's annual electricity needs, if not its capacity requirements.

Friday, March 1, 2019

Value lessons from Ontario electricity statistics

Data - and lots of it.

While I'll try to prevent this post from sliding into an abyss of Ontario electricity statistics, I'll be citing provincial data as the basis for discussion about public understanding being restricted by the presentation of data from official sources, and present new views of generally unreported data that would benefit literacy in valuations of electricity sources - an area where reckless ignorance blooms again and again.
but enough about academics, let's dive in!

The old standard of valuing generation sources is the Levelized Cost of Electricity (LCOE ). I was particularly pleased in late 2015 when a report from Ontario's Auditor General included a figure (5) indicating the cost and quantity of energy sources for 2014. I was more pleased a few years later when I received figures from a freedom of information (FOI) request with the same information for years 2007-2015. While I think the data is terrific, when I wrote about it I cautioned on presenting LCOE, "stressing these calculations deserve a big asterisk and lengthy footnote on the impacts of things such as curtailment and capacity payments." 

I have now done the data work required to add that lengthy footnote on curtailment and capacity payments.

I am certainly not unique in hoping for superior valuation tools to LCOE: the U.S. Energy Information Administration (EIA) has developed a  Levelized Avoided Cost of Electricity (LACE) metric, and the International Energy Agency (IEA) a Value-Adjusted Levelized Cost of Electricity (VALCOE - see pg 41). LACE is intended to value the cost (of alternatives) avoided by the generation, with the intent LACE > LCOE would signal a good project. VALCOE attempts to recognize the different capabilities of sources in providing firm capacity and flexibility. The specifics are less important than the principles: not all generation is of equal worth to systems that are intended to minimize loss-of-load situations. Concrete examples of LUEC's limitations will help conceptualize the issues that have people looking for better valuations.

Before I discuss my data I will note one other frequently cited source of Unit Cost in my province (I regard LUEC and LCOE as interchangeable terms): the Ontario regulator. Their most recent explanation of regulated rates includes a table (3) indicating hydro at 6.2 cents per kilowatt-hour, nuclear at 7.7, wind at 15.9, gas at 18.8 and solar at 51.3 c/kWh. I'll show replacing the OEB list's lower cost supply with gas is likely to lower total costs.

I have collected hourly data for the transmission-connected (Tx) generators reported by Ontario's system operator, including imports, and I've estimated (hourly) distribution-connected generation (Dx), curtailed supply, and contracted cost, either by unit generated (or curtailed), or by capacity required to be available. My base union query in working the data has over 16.4 million records. I will not repeat the word "estimate" in this post but simply note this one time it may be applied to everything (my work and the numbers from the IESO and OEB I cite).  

Here is my summary of annual generation and costs from 2008-2018:

Monday, February 18, 2019

A message from 2018 Ontario electricity statistics

Two notable aspects of 2018's electricity numbers in Ontario: average rates did not substantially increase, and demand did. Both of these buck the trend of the past decade. I'll explain how the trends broke.

The IESO's December reporting shows year-to-date Class B Wholesale Market rates of:

  • $114.94/MWh in 2018
  • $115.55/MWh in 2017
  • $113.18/MWh in 2016

That should be the most accurate source for this one consumer category, although the IESO did bungle November's rates due to an error in consumption figures (they compensated for it in December by pretending 688.6/8.695= 74.04). In 2017 they bungled June's consumption figures (which was accounted for in July, pretending 913.4/8.858 =112.8). These details demonstrate all IESO figures should probably be treated as estimates too - so I'll stick with my own data work here, and a graphic demonstrating the trends in different consumer segment pricing I developed, and explained in Trends in Ontario Electricity rates by Consumer Segments


Sunday, November 25, 2018

Smart gift ideas: electricity monitors and hot water

The big deals of the early Christmas shopping season are coming to an end soon, so it’s a little late for advising on purchases, but I have been looking at some product and thought a post on what, and why, might be of interest. Like some - if not many - when I think gifts I think of addressing energy consumption, the new technology of a smarter “internet of things” (IoT), and emissions from energy use. Having served a decade in retail some time ago, I also think of selling as much as buying.

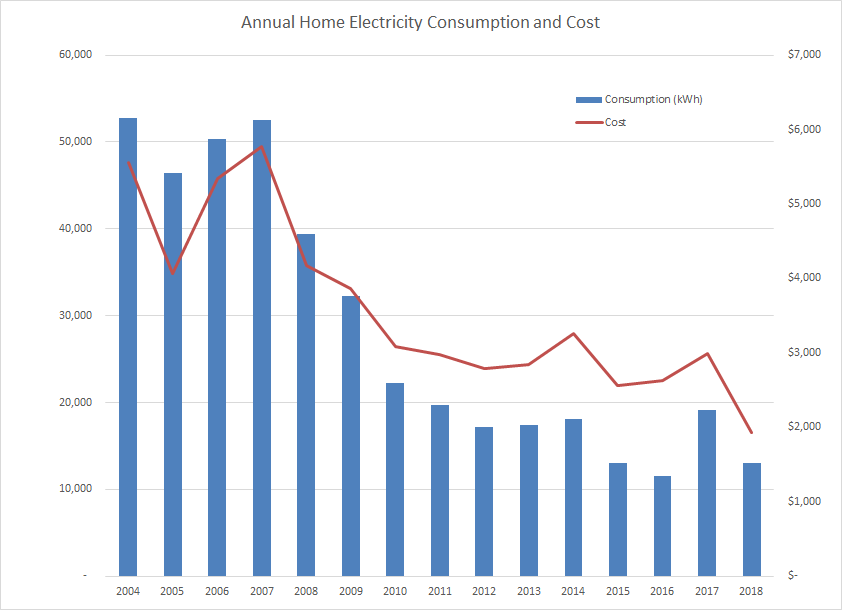
Some background on my electricity consumption history. Our current home uses much less electricity than it did when we arrived a decade-and-a-half ago. I wrote on the house early in 2015 after we’d received natural gas and installed a forced-air furnace and my beloved gas stove.

A quick narrative for the chart: from 2004 to 2007 the living space grew considerably (30+%) - efficiency improved although consumption doesn’t show it. Then the wood stove years began (about 3 full cords a years) and more of the house was renovated/insulated. At the end of 2014 gas arrives (we consume 1000-1100 cubic meters a year), and wood consumption is halved. The blip up in 2017 was due to a project by another member of the household (quite a productive one), which ended early this year and consumption is falling back accordingly. Electricity consumption is above the average for Ontario homes, but there may be very few homes at that average as those that heat water with electricity (as I do) are likely above average, and others probably below.

And then there’s cost.

Monday, March 5, 2018

Transmission constraining Ontario's Niagara Hydroelectric potential

I was recently asked why I claim there are transmission constraints on electricity generation from Ontario Power Generation (OPG) Niagara river system generators.

I’ve written a number of times on production levels and argued the constraints largely because I have consistently found the actual output from OPG’s 5 Niagara system generators less than it could be. There are current reasons to revisit the issue:
  • In 2017 the total was 11.32 TWh[1], which is probably the lowest level since I first appeared, in 1965,
  • OPG reported 4.5 TWh of "forgone hydroelectric generation" due to surplus baseload generation (SBG) in the first 9 months of 2017, up 15% from 2016 when OPG's annual foregone generation was 4.7 TWh, 
  • OPG intends on adding 106 megawatts of capacity through an overhaul of  two idled old units at the Sir Adam Beck I Generating Station
I’ll review the annual generation data but acknowledge the lowered generation doesn’t prove a transmission constraint - so I’ll also build a timeline demonstrating increased transmission was deemed necessary a decade ago, and the need must have grown significantly, along with generating capacity in the region, since then.

My curiousity on the topic of foregone generation was piqued in June 2011 by an article in the Buffalo News.[2] The article discussed Canada’s inability to utilize all the water it had rights to in generating electricity on the Niagara river, and OPG's Niagara Tunnel project that was to address that, increasing generation by 1.6 TWh. In March 2013 the tunnel was declared, by OPG, to be in-service.

By 2014 I was utilizing Hourly Generator Output and Capability reporting from Ontario’s system operator (IESO) to collect data on individual generators[3], and U.S. Energy Information Administration (form EIA-923) data for the generators on the U.S. side. The comparisons showed OPG output falling far behind the U.S. generation on the Niagara river[4] - a trend which has since, surprisingly, accelerated.


When the output at OPG’s generators did not increase after the Niagara tunnel project completion, I looked for other causes.

Thursday, March 1, 2018

Review of 2017 electricity supply in Ontario

You purchase a  full 9-unit container of energy .
The 3 men who deliver it pour out 2 units out while lecturing on consumption. 
They imply you should make more yourself as they leave.

A couple of months have passed since I last posted to the blog. This may be due to writer's block, or a lack of ambition - or maybe I was wisely waiting until I had something nice to say!

With growing knowledge, and curiosity, I seem to muddle all little issues into the broad themes I deem important - and not only for energy. In this post I'll touch on metrics from 2017 the reader may be looking to this blog to find, with hopes of connecting the data to bigger issues.

There are many possible headlines from an annual analysis:
  • electricity "demand", as reported by the system operator was down, to levels not seen in decades
  • supply generated from fossil fuels (natural gas) was sharply down too, and again to levels probably not seen in over over half a century
  • prices for consumers on regulated price plans were sharply down in 2017 due to legislation and consequent debt (the [un]Fair Power Plan), but,
  • total costs for supply declined in 2017, although average unit cost was up slightly (as demand declined more)
  • nuclear supply was down as one unit (Darlington 2) was out of service for the entire year due to refurbishment, but the units remaining online largely took up the slack as Bruce Power had record output, as did the set of 9 units at Ontario Power Generation which operated during 2017, and
  • for the first year since the system operator reported on their system's wind output, in 2006, it reported a decline (albeit a very slight one)
I didn't wish to dwell on numbers in this post. During 2017 I learned some new data reporting tools which I put on on a site where I invite data-gluttons to learn the filters and views to generate the typical year-end summary statistics, such as the total annual biomass generation for the past decade.
I do wish, in this post, to combine commentary to statistics to demonstrate very good figures from one perspective can have bad implications from a broader perspective. This is particularly important to note as the reasons rates didn't rise sharply in 2017 aren't sustainable.

Friday, November 17, 2017

A benefit of Electricity trade - and what's reducing it

I was wrong.

I've been broadcasting a couple of messages about Ontario's electricity exports: that only the IESO can accurately report on the revenues, and that exports at negative prices are not allowed under market rules. It now seems neither of those is correct. Not only can export revenues be calculated, the analysis of export volumes, and revenues over time reveals benefits of markets, and trade. It's not at all clear Ontario's electricity powers understand the benefits.

I was recently alerted to a claim that the export revenues could be calculated from Intertie Schedule and Realtime Market Price reports. If that sounds confusing it'll gets worse before I'll try to ease off the jargon. As the Intertie Flows reporting is hourly, and the Realtime Market Price reports in 5 minute intervals some data manipulation is required to match the data sets. The IESO has posted annual files (.csv) with values from each of these reports for 2010 through 2016. To dispatch with the technical talk in one confusing swoop, I'll simply note that averaging the "ENGY" rate by delivery hour for each control area in the Realtime Market Price reports, and multiplying that by the "OFFT" value in Intertie Flows report for the same control area does result in the annual figures the IESO has released either to the Office of the Auditor General or in response to Freedom of Information Requests.
I can now extend my work from a previous post to include 2016 data.


Having worked the data down to the hourly time-frame by control area I can additionally summarize revenues, and costs, by jurisdiction. The results have some important messages about trade - as each "control area" has a separate market control price.

I won't discuss imports much in this post because there's nothing new to discuss. Most imports into Ontario are now from Quebec (over 82% since 2012 began), and those are valued in the new analysis almost exactly as the typical Hourly Ontario Energy Price (HOEP) valued them.

Messages about trade from this analysis may be hidden by the realities of communicating summaries of very large data sets. I posted some graphics on hydro(electric) generation by river system, and I received an e-mail from somebody who likely wanted to pursue a story, asking if the data was public knowledge. It was every bit as much public knowledge as what I am writing on today - summarized from hourly data captured from IESO hourly reporting since 2010. However, as most can't process the hourly information, and an official source had not published a summary, it wasn't the basis of a story. I think publication of a summary by an official source is what is required to be considered "public available".

The IESO once summarized volumes and revenues for exports and imports on a web page at www.ieso.ca/imoweb/siteshared/imports_exports.asp (long since a dead link). These monthly totals were meaningfully publicly available as they were both available and summarized by a trusted figure. Remnants of the IESO summaries remains in old government press releases, such as this from May 2012:
"Ontario's electricity market generated over $20 million in April by exporting electricity to other states and provinces, bringing total net export revenues to over $75 million this year.
That figure was, in hindsight, actually net exports ($28.6 million revenue from exporting less $8.1 million importing cost). In 2012 I noted:
[my] figures on export sales are estimates based only on the [Hourly Ontario Energy Price] ... in actuality export customers pay different rates. Because Ontario's market pricing is lower, sometimes much lower, than adjacent jurisdictions, it appears from both the ministry 'news' releases, and National Energy Board reporting, we generally export power about 10% above the HOEP  rates.
10% was the assumption I had when the IESO ceased summary reporting, but with the base data now summarized, I now know that assumption became wrong as they moved up and up, to nearly 70% above HOEP valuations by 2016.


Friday, September 29, 2017

Ontario Electricity Operator brags of ICI subsidy, continues spending on wind experiment

7 days after news broke of a lawsuit claiming the global adjustment charge is “an unconstitutional tax, not a valid regulatory charge,” Ontario's electricity system operator (IESO) issued a news release congratulating their generators and certain consumers:
Ontario’s peak demand days typically don’t happen at this time of the year. Yet with hot weather persisting, and in spite of summer’s end last week, the province experienced new annual peaks this week of 21,786 MW on Monday and 21,542 MW on Tuesday.
Generators did their part to help meet the peaks, as well as Ontario’s consumers participating in the Industrial Conservation Initiative (ICI) and other demand response initiatives.
According to preliminary analysis, consumers participating in the ICI are estimated to have reduced peak demand by over 1,500 MW this week. By reducing demand during peak periods, ICI participants can both reduce their electricity costs while helping to defer the need for investments in new electricity infrastructure that may otherwise be needed.
They didn't mention if the 21,783 MW remains 2017's annual peak it will be a record annual low (the 3rd one recorded in the past 4 years).


Thursday, August 10, 2017

Ontario may contract more imports from Quebec - badly

On the morning of Tuesday August 8th La Presse published an article reporting on a draft contract which would see Ontario pay Quebec approximately $500 million a year for the ability to import 8 terawatt-hours of electricity. By late morning the office of Ontario's energy minister denied an agreement was reached, and the ruling Liberal party's press office was slamming the opposition party for "spreading misinformation."
Perhaps nothing will come of the proposal, but it's worth noting what constituency it is designed to appease, how that appeasement impacted the draft agreement, and the concerns all Ontarians should have with the processes, and institutions, involved in the province's electricity sector.

A timeline surrounding the leaked draft document dated June 22, 2017:

  • during May Ontario's Minister of Energy GlennThibeault and this Quebec counterpart, Pierre Arcand, discuss "the possibility of further enhancing electricity trade in order to cost-effectively improve our respective electricity systems," [source]
  • La Presse's report, translated on Google Chrome, includes, "Thibeault sent a letter to his Quebec counterpart...on June 13 to explore the possibility of entering into a new long-term agreement to purchase electricity",
  • June 20th Peter Gregg "takes on the role of IESO President and CEO",
  • June 22nd Hydro-Quebec's Steve Demers writes a "Dear Peter" letter to the new head of Ontario's system operator introducing a written proposal valid until July 14,
  • July 27 Ontario's Thibeault writes the June offer was "inconsistent with our discussions in May", notes following discussions between staffs of Premier's Couillard and Wynne HQ "would be instructed to work collaboratively with IESO on enhancing electricity trade..."

I think Thibeault's July 27th is very good. To communicate why, I will focus on a short technical quote from the leaked draft agreement which explains the shortcomings of Hydro-Quebec's proposal. 

First I'll note 8 TWh, the proposed annual import level, is only slightly higher than the total annual imports into Ontario from Quebec (much of which will be wheeled through to New York). There was some noise about whether the amounts were feasible with existing infrastructure: they are.


Friday, June 23, 2017

Solar: Ontario's Base-Value Power

What is the generation source least valued by Ontario's electricity market in 2017?

That is the question I asked on twitter the other day. I know it's not the most serious format, it's a small sample size, and my running the poll means there will be selection bias in the responses. I did invite others with different views of the energy world to share it - but they did not.


I got some feedback that the question was unclear. While there are multitudes of factors impacting/corrupting the metric, this question is precise. The IESO allegedly operates Ontario's electricity market, they do publish summaries for hourly generation by fuel (xml format) and they do publish an Hourly Ontario Energy Price (.csv format).

The least valued "fuel" - or generation source - this year as the 22nd of June, is the lowest valued by a big margin, lying 29% below the next least valued.

The lease valued source is the source least expected to be the least valued.

The least valued source is solar.

Which shouldn't come as a surprise. 
I'll briefly review the theory, put Ontario's experience in a broader context, and finally cherry pick one day to examine. Cynics may be surprised the day is June 12th, which is the highest demand day of 2017.

Wednesday, December 21, 2016

Historical ignorance: on energy losses in decadent Ontario


Accusations of losses on electricity exports, and government denial of the fact, is far from news, but the reappearance of the topic in Ontario's legislature demands it be reviewed anew.
Progressive Conservative Leader Patrick Brown says the province sold $9.4 million worth of excess electricity for just $144,000 on Nov. 10...
Brown says Ontario has "given away" $6 billion in surplus electricity since 2009 by selling it at a big loss...
Energy Minister Glenn Thibeault...says Ontario made $230 million in 2015 by selling excess electricity to neighbouring jurisdictions.
Thibeault says Ontario suffered through power shortages and brown outs when the Conservatives were last in power, and had to spend up to $500 million a year to buy electricity from its neighbours to keep the lights on.
   -the Canadian Press via ctvnews.ca
I wrote on the costs to Ontario ratepayers of cheap exports almost 6 years ago, in rebutting the same spin as the Minister delivered yesterday when presented by a previous Premier. Later, in 2013's Ways to estimate Ontario's losses on electricity exports I demonstrated multiple methods to quantify losses on exports. The estimates of losses vary by methodology and assumptions, but if methods are applied consistently all indicate increased costs to Ontario consumers from producing far more electricity than necessary to meet their demands .

I won't revisit all the arguments I've made in the past, but instead tailor a response to the rookie Minister's old denials, emphasizing how poorly he is prepared to undertake the task of developing a plan for the sector.

Monday, May 16, 2016

Waste Deep in the Nipigon

Ontario increasingly wastes electricity.

Wasting electricity is nothing new. I have a recurring earworm originating in a 1970's Ontario Hydro advertising campaign; "wasting electricity turns people off." In the decades since we are often reminded we use the wrong light bulb, the phone charger wrongly, water stupidly, and on and on. But today's waste includes actually curtailing emissions-free generation, without consumer savings, simply because there aren't consumers that can use the electricity. Much of that waste is avoiding generation from the public hydro-electric generation that gave the former  public utility the name "Ontario Hydro." Ontario Hydro is gone, but it's generators survive under Ontario Power Generation (OPG). I present OPG's generators on the Nipigon river as an example of the waste occurring in today's IESO administered electricity system.

The Nipigon river was in the news this winter as a new and unique, to the climate, cable-stayed bridge heaved, closing the TransCanada highway to all traffic for days, and requiring heaving loads to drive around Lake Superior for a much longer period. The bridge design was selected, at least in part, as it "eliminates the need for in-water structures in the Nipigon River."

15 kilometers (km) away, the Alexander Generating Station is an in-water structure that first started producing power in 1930. The current capacity is 69 megawatts (MW).

2 km upriver of that is the older Cameron Falls Generating Station, with a capacity of 92 MW.

OPG's Pine Portage Generating Station
17 km upriver of that is the newest, and largest of OPG's Nipigon River system generators, the 144 MW capacity Pine Portage Generating Station. A substantial reservoir exists behind Pine Portage:
Forgan Lake, south of Lake Nipigon, was created when Pine Portage was built. Forgan Lake was named by a decision of the Canadian Board of Geographic names on November 3, 1949. The lake comprises Hannah Lake and Creek, Eva Lake, Pine Point, Devil Rapids, Victoria Rapids, Emma Lake and others.
Conceptually, the same water provides electrical power 3 times, with it's journey through all three generators controlled at Pine Portage.

I've been tracking hourly generation reported by the IESO since September 2010.[1] To eliminate the typical monthly variations over the course of a year, I've graphed the moving 12-month total of each of OPG's 3 Nipigon River generators:


The decline of production at the Pine Portage generating station is obvious, and so dramatic in recent months I asked OPG on twitter if they, "would like to comment on reduced production at Pine Portage GS before I speculate." OPG responded, "Pine Portage GS is available to run if required. Suggest you contact @IESO_Tweets for demand information."

Wednesday, March 30, 2016

Ontario's curtailed wind energy

Ontario's electricity system operator, the IESO, recently released multiple reports including a summary page for 2015's supply now inclusive of "dispatched down" data for industrial wind turbines (in the same format as their 2014 summary). This is the one instance during a year I can compare my estimated curtailment the IESO's reported curtailed wind supply. This year there are similarities, such as the wind curtailments significantly increasing, and there are differences, which I've used to adjust my methodology for estimating hourly curtailments.

The IESO data is not a comprehensive curtailment report. By "curtailment" I mean supply which is rejected by the IESO through any process. My definition includes Ontario Power Generation (OPG) hydro. OPG reports:
During each of 2015 and 2014, OPG lost 3.2 TWh of hydroelectric generation due to SBG [surplus baseload generation] conditions.
For both years, the OPG hydro losses double the amount of curtailment the IESO shows for the combination of "nuclear reductions" and "wind dispatched down."