Sunday, November 25, 2018

Smart gift ideas: electricity monitors and hot water

The big deals of the early Christmas shopping season are coming to an end soon, so it’s a little late for advising on purchases, but I have been looking at some product and thought a post on what, and why, might be of interest. Like some - if not many - when I think gifts I think of addressing energy consumption, the new technology of a smarter “internet of things” (IoT), and emissions from energy use. Having served a decade in retail some time ago, I also think of selling as much as buying.

Some background on my electricity consumption history. Our current home uses much less electricity than it did when we arrived a decade-and-a-half ago. I wrote on the house early in 2015 after we’d received natural gas and installed a forced-air furnace and my beloved gas stove.

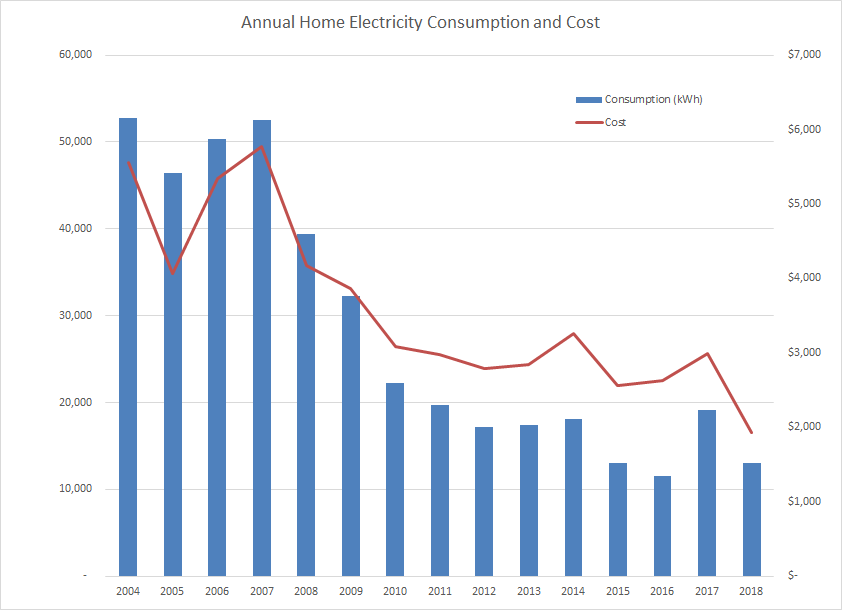
A quick narrative for the chart: from 2004 to 2007 the living space grew considerably (30+%) - efficiency improved although consumption doesn’t show it. Then the wood stove years began (about 3 full cords a years) and more of the house was renovated/insulated. At the end of 2014 gas arrives (we consume 1000-1100 cubic meters a year), and wood consumption is halved. The blip up in 2017 was due to a project by another member of the household (quite a productive one), which ended early this year and consumption is falling back accordingly. Electricity consumption is above the average for Ontario homes, but there may be very few homes at that average as those that heat water with electricity (as I do) are likely above average, and others probably below.

And then there’s cost.

Monday, November 12, 2018

Trends in Ontario Electricity rates by Consumer Segments


The graphic illustrating trends in electricity pricing in Ontario will be more impactful with some explanation. First I'll deal with the terminology housekeeping, allowing for some discussion of the trends.

Definitions/Terminology

  • Regulated Price Plan (RPP) consumers are most residential and small business consumers whose rates are set by the Ontario Energy Board (OEB), essentially on a forecast of supply costs over the next 12 months;
  • Class B consumers pay the flow-through cost of supply on their monthly bills (although usually as an estimate);
  • Class A consumers were the very largest consumers in the province - as of 2011 they could lower their bills by lowering their consumption during 5 peak hours;
  • Exporters pay only a real-time market price (RTP) for supply.
The Class A commodity rate is calculated as the statistical average Hourly Ontario Energy Price (HOEP) plus the average global adjustment for the class (total Class A charges divided by consumption). The Class B commodity rate is calculated as the weighted average HOEP plus the average global adjustment rate for the class. The global adjustment in my estimates differs slightly from figures reported by the IESO as global adjustment figures are publicly disclosed at gigawatt-hour level (GWh), while I expect the IESO calculated at a finer level of detail.

Exporters do not pay the global adjustment, and they settle at the real-time price (RTP) for particular jurisdictional interties, not the HOEP. As I only have RTP data from 2010 on, the figures from 2005 to 2010 are based on the HOEP which effectively underestimates the average cost. From other data (including this) it is known the actual average intertie-specific RTP value realized on exports was about 10% higher than the HOEP value during those years.


Two average rates are shown: the average for Class A and B (or, prior to the introduction of the classes in 2011, simply the Ontario average) is shown as the "Average Ontario Commodity Rate", and the "Average Commodity Rate" which also includes exports. Those averages are all weighted according to the consumption of each consumer class. Notably, RPP rates are not in the average calculations (as they should simply be a different type of Class B rate).

Discussion and Analysis