Showing posts with label baseload. Show all posts

Sunday, July 7, 2019

Baseload's threatened ability to contribute to lower emissions

“Baseload” is a contentious term in energy discourse. In analysing electricity data in Ontario it occurred to me there’s a simple way to demonstrate the potential value of supply that delivers a consistent output all of the time - one that ignores all generation technology, using only hourly demand data. In this post I’ll demonstrate this methodology before discussing implications for supply mixes.

“Base” and “Load” are two fairly well-defined terms - neither of which are strictly adhered to in my methodology.

“Load” I treat as whatever data I have. I’ve collected available hourly, or half-hourly, data for 3 Canadian provinces, 5 Australian states, and 5 US systems. The data is unlikely to be equal: one example is the figure used for Alberta is “Alberta Internal Load” which includes “behind-the-fence” self-generation unlike the Ontario system operator’s “Ontario Demand”, which only reflects supply from their grid. I am not aware of what supply is included, or excluded, in data I’ve collected from the U.S. Energy Information Administration (EIA) or the Australian National Energy Market. Until the case study section of this analysis the differences can be ignored.

“Base” could be called minimum, but I think it’s helpful to eliminate outliers. The most extreme example is the great blackout in August 2003 that impacted most of Ontario, but more generally there will be some ideal nights on holiday weekends where demand is below its normal lows. In this analysis I define “Baseload” in relation to the statistical mean, which is better known as the Average (A) by those of us who determine it using the available spreadsheet, or other database, function.

While I am well-acquainted with data, I’ve only met statistics. Wikipedia explains the standard deviation, represented by the symbol “σ” (sigma), “is a measure that is used to quantify the amount of variation or dispersion of a set of data values,” and provides a very helpful graphic displaying 1st, 2nd and 3rd standard deviations on a plot of a normal distribution.
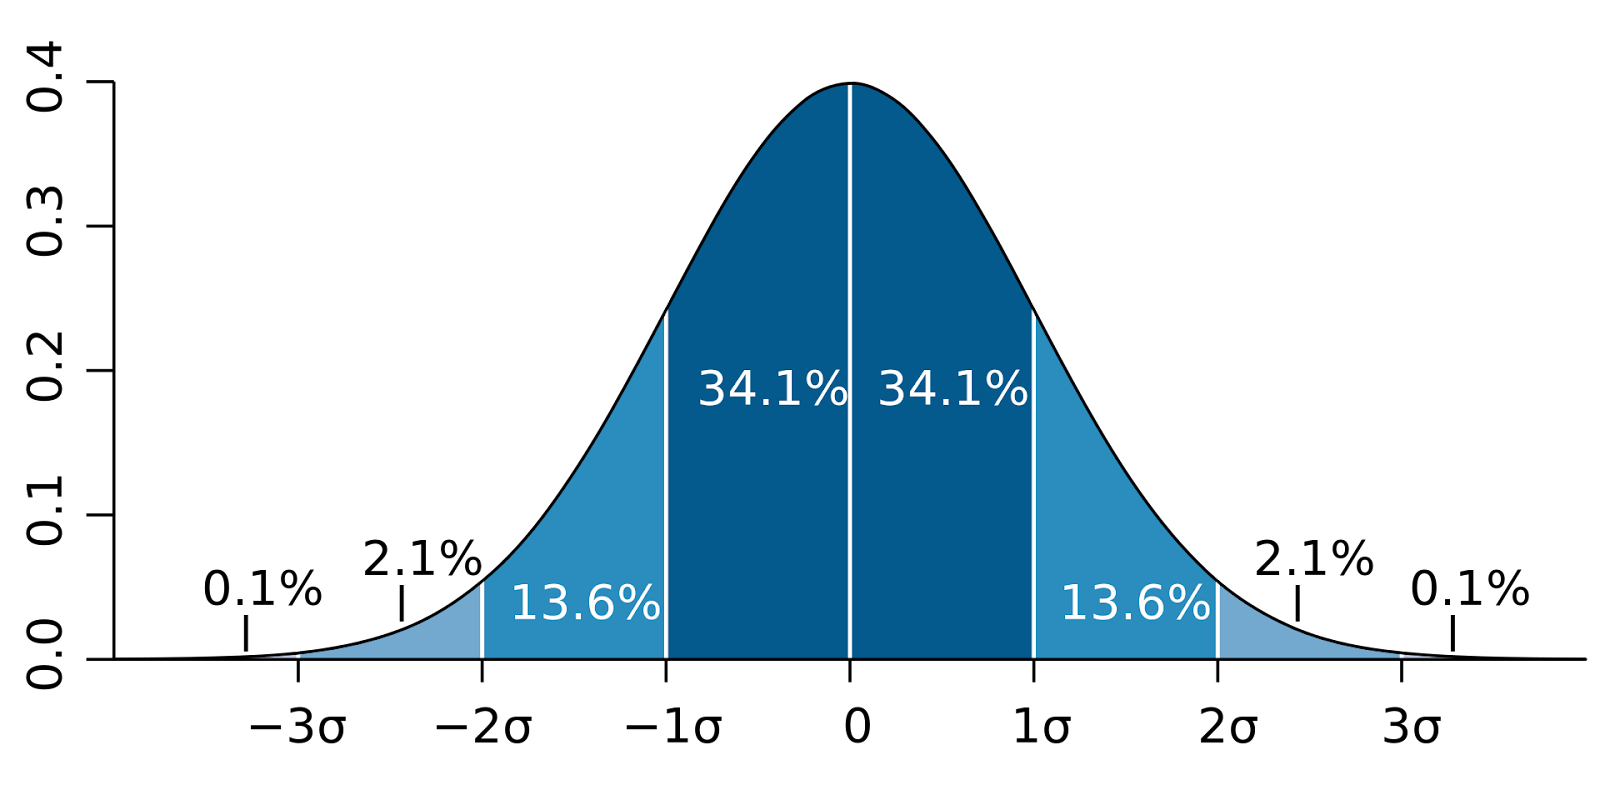
(By M. W. Toews - Own work, based (in concept) on figure by Jeremy Kemp, on 2005-02-09, CC BY 2.5, https://commons.wikimedia.org/w/index.php?curid=1903871)

People who are well-acquainted with statistics might be able to anticipate the results of much of my analysis, and probably could use it to determine how the distribution of electricity demands differs from a standard distribution. For instance, the average percentage of hours where I find demand is below A - σ (the statistical mean less one standard deviation), in 13 electricity system hourly data sets, is 15.45%: in the diagram above of a standard distribution it’s 15.8%. That result should not surprise a statistician, but perhaps some other metrics I’ve collected will be - and if not I will attempt to present the analysis for those that those unfamiliar with statistics.

Friday, March 1, 2019

Value lessons from Ontario electricity statistics

Data - and lots of it.

While I'll try to prevent this post from sliding into an abyss of Ontario electricity statistics, I'll be citing provincial data as the basis for discussion about public understanding being restricted by the presentation of data from official sources, and present new views of generally unreported data that would benefit literacy in valuations of electricity sources - an area where reckless ignorance blooms again and again.
but enough about academics, let's dive in!

The old standard of valuing generation sources is the Levelized Cost of Electricity (LCOE ). I was particularly pleased in late 2015 when a report from Ontario's Auditor General included a figure (5) indicating the cost and quantity of energy sources for 2014. I was more pleased a few years later when I received figures from a freedom of information (FOI) request with the same information for years 2007-2015. While I think the data is terrific, when I wrote about it I cautioned on presenting LCOE, "stressing these calculations deserve a big asterisk and lengthy footnote on the impacts of things such as curtailment and capacity payments." 

I have now done the data work required to add that lengthy footnote on curtailment and capacity payments.

I am certainly not unique in hoping for superior valuation tools to LCOE: the U.S. Energy Information Administration (EIA) has developed a  Levelized Avoided Cost of Electricity (LACE) metric, and the International Energy Agency (IEA) a Value-Adjusted Levelized Cost of Electricity (VALCOE - see pg 41). LACE is intended to value the cost (of alternatives) avoided by the generation, with the intent LACE > LCOE would signal a good project. VALCOE attempts to recognize the different capabilities of sources in providing firm capacity and flexibility. The specifics are less important than the principles: not all generation is of equal worth to systems that are intended to minimize loss-of-load situations. Concrete examples of LUEC's limitations will help conceptualize the issues that have people looking for better valuations.

Before I discuss my data I will note one other frequently cited source of Unit Cost in my province (I regard LUEC and LCOE as interchangeable terms): the Ontario regulator. Their most recent explanation of regulated rates includes a table (3) indicating hydro at 6.2 cents per kilowatt-hour, nuclear at 7.7, wind at 15.9, gas at 18.8 and solar at 51.3 c/kWh. I'll show replacing the OEB list's lower cost supply with gas is likely to lower total costs.

I have collected hourly data for the transmission-connected (Tx) generators reported by Ontario's system operator, including imports, and I've estimated (hourly) distribution-connected generation (Dx), curtailed supply, and contracted cost, either by unit generated (or curtailed), or by capacity required to be available. My base union query in working the data has over 16.4 million records. I will not repeat the word "estimate" in this post but simply note this one time it may be applied to everything (my work and the numbers from the IESO and OEB I cite).  

Here is my summary of annual generation and costs from 2008-2018:

Sunday, November 25, 2018

Smart gift ideas: electricity monitors and hot water

The big deals of the early Christmas shopping season are coming to an end soon, so it’s a little late for advising on purchases, but I have been looking at some product and thought a post on what, and why, might be of interest. Like some - if not many - when I think gifts I think of addressing energy consumption, the new technology of a smarter “internet of things” (IoT), and emissions from energy use. Having served a decade in retail some time ago, I also think of selling as much as buying.

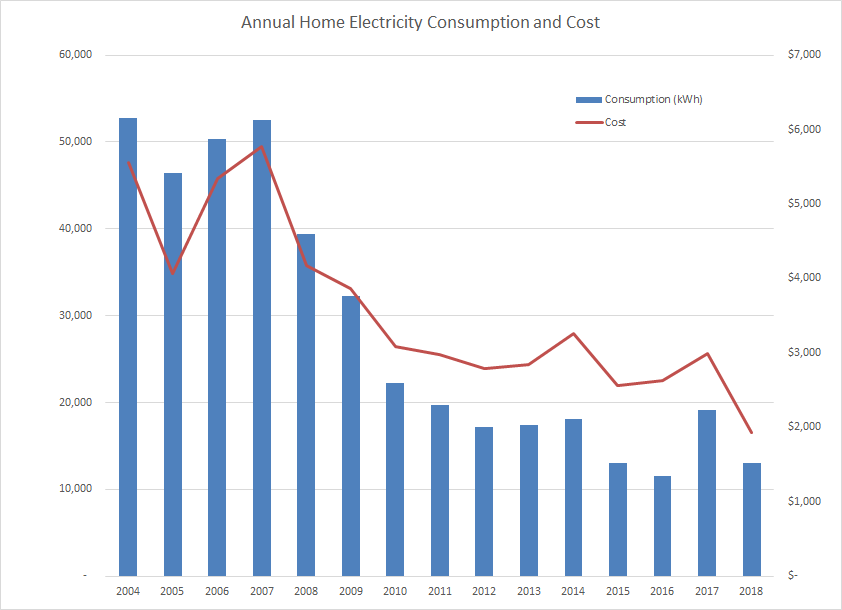
Some background on my electricity consumption history. Our current home uses much less electricity than it did when we arrived a decade-and-a-half ago. I wrote on the house early in 2015 after we’d received natural gas and installed a forced-air furnace and my beloved gas stove.

A quick narrative for the chart: from 2004 to 2007 the living space grew considerably (30+%) - efficiency improved although consumption doesn’t show it. Then the wood stove years began (about 3 full cords a years) and more of the house was renovated/insulated. At the end of 2014 gas arrives (we consume 1000-1100 cubic meters a year), and wood consumption is halved. The blip up in 2017 was due to a project by another member of the household (quite a productive one), which ended early this year and consumption is falling back accordingly. Electricity consumption is above the average for Ontario homes, but there may be very few homes at that average as those that heat water with electricity (as I do) are likely above average, and others probably below.

And then there’s cost.

Monday, April 9, 2018

Base load and baseload generation

The term baseload gets thrown around frequently but seldom is associated with a base, or minimum, load. It occurs to me the level of knowledge in discussions on electricity supply could benefit from reviewing the level of total electricity that would be met by a mythical generator running throughout at a the year at the minimum system demand. The results are not surprising,but the current level of discourse indicates the results are not intuitive.

I’ve revisited hourly load data I’ve collected over the past year for two provinces and British Columbia (bce … or BC). Each data set measures “load”, or demand, differently, but the particulars are not important for this simple review. For each province’s data set, I’ve queried the minimum annual load along with the average. Upon reflection it’s obvious that the minimum load divided by the average load produced the percentage of annual supply that could come from the steady production of the minimum load.


Differences between years are minimal, but the difference between Alberta and the other 2 provinces is significant. Alberta’s flat load profile means 80% of annual generation could usually be met by consistent supply at the base load level. “Alberta Internal Load”, or AIL, is the statistic used, and it includes behind-the-fence generation which is large due to extensive cogeneration, particularly from oil sands operations. Large industrial loads tend to be far more consistent than, particularly, residential demands. In Ontario and BC the reported loads, which omit behind-the-fence generation, indicate over 2/3rd of supply requirements would be met by output at the base load level.

For reasons I’ll return to in discussing implication of this base load supply level review, I ran some figures estimating how much usable supply would come from increasing the base supply level to 10% above the annual base load level, and with base supply 20% above base load.