Showing posts with label Electricity - Conservation. Show all posts

Friday, March 29, 2019

f in efficiency: Free-riders of the soft path

There are lots of opinions on energy, but only one most acceptable conclusion to a discussion of what actions should be pursued - it is some variation on, "and of course efficiency, we have to do all the the conservation we can first." This signals everybody to nod approvingly and terminates the discussion.

I don't agree - which is a difficult position given the culture that views any energy analysis with the assumption "efficiency" (often used interchangeably with "conservation") is the most effective way to reduce costs. In this post I'll challenge the usefulness of a perspective that values negawatts above megawatts.

Before moving to some foreign data from the American Energy Information Administration (EIA), I'll introduce a graphic showing both official estimates of a levelized cost of energy (LCOE) for efficiency in Ontario, and the LCOE I estimated of available but not utilized cheap supply. I've added trend-lines to emphasize that while I find the cost of efficiency was higher than foregone supply until 2015, the claimed LCOE has dropped quicker and appears cheaper than the foregone supply in recent years. I'll need to cover a lot of ground before arriving at a place to explain why that is.


Thursday, March 7, 2019

Available low-cost electricity not utilized in Ontario

All figures are estimated (view in workbook)

In preparing my previous post I created a graphic posted separately on Facebook and Twitter. The graphic got more views than the post I edited it out of.

Comments on the original graphic included thoughts from the "electrify everything" perspective. I responded with too much caution, noting shrinking supply. Having given topic some more thought, I've added dumped exports as supply that has been available to Ontarians over the past years, on top of curtailed potential supply and under-utilized gas generators. In this post I hope to provide some context to the graphic, and show why coming changes in supply don't present a challenge for meeting Ontario's annual electricity needs, if not its capacity requirements.

Sunday, November 25, 2018

Smart gift ideas: electricity monitors and hot water

The big deals of the early Christmas shopping season are coming to an end soon, so it’s a little late for advising on purchases, but I have been looking at some product and thought a post on what, and why, might be of interest. Like some - if not many - when I think gifts I think of addressing energy consumption, the new technology of a smarter “internet of things” (IoT), and emissions from energy use. Having served a decade in retail some time ago, I also think of selling as much as buying.

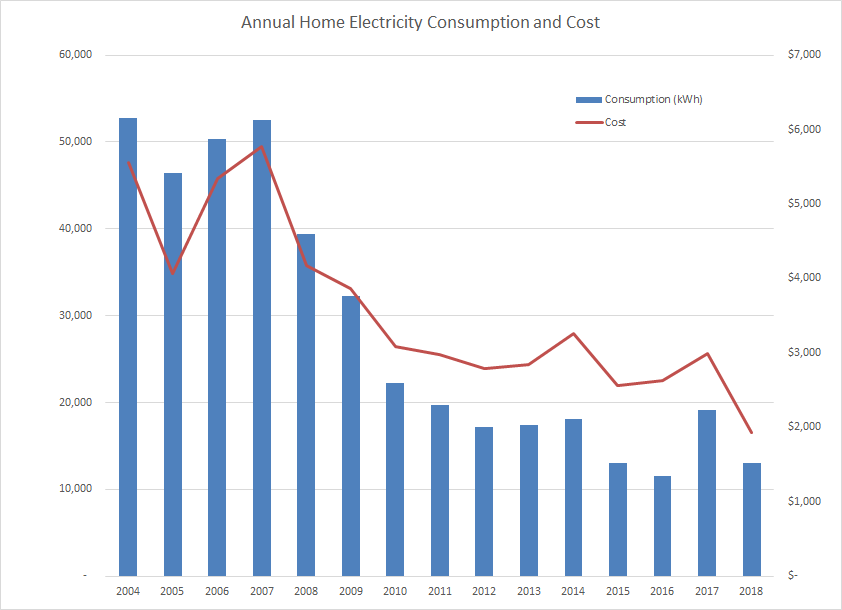
Some background on my electricity consumption history. Our current home uses much less electricity than it did when we arrived a decade-and-a-half ago. I wrote on the house early in 2015 after we’d received natural gas and installed a forced-air furnace and my beloved gas stove.

A quick narrative for the chart: from 2004 to 2007 the living space grew considerably (30+%) - efficiency improved although consumption doesn’t show it. Then the wood stove years began (about 3 full cords a years) and more of the house was renovated/insulated. At the end of 2014 gas arrives (we consume 1000-1100 cubic meters a year), and wood consumption is halved. The blip up in 2017 was due to a project by another member of the household (quite a productive one), which ended early this year and consumption is falling back accordingly. Electricity consumption is above the average for Ontario homes, but there may be very few homes at that average as those that heat water with electricity (as I do) are likely above average, and others probably below.

And then there’s cost.

Sunday, June 17, 2018

Ontario Electricity: Backgrounder and suggestions for Premier Ford

Ontario has a new Premier. Congratulations to Doug Ford who, despite my recent quiet, is receiving a lot of free advice on addressing costs in Ontario's electricity. Some of it good, but much of it not only bad, but based on flawed views of how Ontario's residential and small business consumers came to experience rapid rate growth.[2] I also have noted some advice - from academics - is oblivious to the new political reality of Ontario. Before getting into thoughts on controlling electricity costs, I'll provide my perspective on the politics of the situations that will determine which suggestions are actionable.

I wrote very little in the run-up to the election because it struck me as a race to the bottom. I used to write on things that angered me (to some extent), and then I'd hope to edit out my annoyance based on, "Nobody cares that I'm angry. What is my point?" This election the point seemed to be people were beyond angry with Kathleen Wynne. I'd call it disgusted. There's a saying in politics that "anger is not sustainable." That's probably true but around the time her government was introducing the ridiculous [un]Fair Hydro Plan I'd wondered if the Wynne policy team had let the anger of the first half of her mandate develop into disgust. Disgust is not an emotion, it's a sense. I was curious to see if I was wrong, and a climb up in the polls was possible for Premier Wynne. I don't think I was wrong - I do think the election was about this sense of disgust, and I found it so unpleasant I voted in the first hour of advanced polling and then tried to ignore it altogether.

I realize many of the angriest were people who follow my blog and know about the Liberal party's enormously wasteful performance in the electricity sector. The waste cost most Ontarians money, but not food, or housing, or heating. With the election over, and the previous governing party embarrassed by failing to win enough seats for official party status, I am hoping many will start the new era of Ford's rule by editing out their anger and trying to find their point. This is not a kumbaya moment though. A real cost reduction of the scope promised by incoming Premier Ford will require tough choices harming real people and angering numerous constituencies, but particularly the one known in the electricity sector as "stakeholders."

Political Constraints

The political reality of the election is pricing carbon is dead: Doug Ford took the leadership in the race for leading the Progressive Conservatives by opposing the recently implemented current cap-and-trade system in Ontario and the federal government's demand province's implement some regime. I'll try to avoid the topic - and fail (but hopefully only once).

Functional Constraints

Ontario's electricity, if mine is any indication, is pretty reliable (the lights stay on) and it is exceptionally clean, with very low emissions of greenhouse gases. My views on what can be done to control costs is influenced by two concerns that I don't see noted very often:
  • capacity
  • industrial electricity costs

Monday, April 16, 2018

Carbon-Con: ECO communication

A couple of weeks I was asked about potential ways to collaborate with reputable sites. I put some thought into that before responding that simply an association with me could bring a site to disrepute, but my thoughts on communication persist. From the belligerent uttering of a federal Minister on a Sunday talk show, to a media blitz from an organization marketing itself as expert on economic tools to reduce carbon emissions, to the Ontario report I'll feature in this commentary, it's been as if a convention of climate change alarm is occurring.

A Climate convention.

Comic Con (short for convention) is a really big event now, which makes some sense in this era of communication. Text is a low impact medium - the sites adding audio and video, integrating with podcasts, have a huge advantage. As the comic and related genres (science fiction, fantasy and superhero) grew from print to screens of all sizes, the graphics and sound growth has simply piled success onto success. The term "simply" recognized almost all characters can be grouped into good or bad.

Perhaps due only to my musing about communication, collaboration and branding, I thought the polarized nature of climate, and energy discussions, make Comic Con a model for communication and promotion in the 'clean tech' industry.

I'd prefer to be a hero, but realize the model needs villains too.

What I hope will be found in my little section of this Carbon Con is data-driven iconoclasm delivered through research, competent data handling, pointed if not visually appealing graphics, and full contact criticism of those blissfully unaware they deserve to be blisteringly opposed.

What many will find is villainy - I've been accused as anti-wind, anti-renewable, anti-conservation, pro-nuclear, disrespect and misogyny. I don't agree with that entire list, but I'm okay with being the villain if it makes for better heroes.

My concern with the profession of professing concern about carbon emissions begins, as most things do, with religion.

Thursday, March 1, 2018

Review of 2017 electricity supply in Ontario

You purchase a  full 9-unit container of energy .
The 3 men who deliver it pour out 2 units out while lecturing on consumption. 
They imply you should make more yourself as they leave.

A couple of months have passed since I last posted to the blog. This may be due to writer's block, or a lack of ambition - or maybe I was wisely waiting until I had something nice to say!

With growing knowledge, and curiosity, I seem to muddle all little issues into the broad themes I deem important - and not only for energy. In this post I'll touch on metrics from 2017 the reader may be looking to this blog to find, with hopes of connecting the data to bigger issues.

There are many possible headlines from an annual analysis:
  • electricity "demand", as reported by the system operator was down, to levels not seen in decades
  • supply generated from fossil fuels (natural gas) was sharply down too, and again to levels probably not seen in over over half a century
  • prices for consumers on regulated price plans were sharply down in 2017 due to legislation and consequent debt (the [un]Fair Power Plan), but,
  • total costs for supply declined in 2017, although average unit cost was up slightly (as demand declined more)
  • nuclear supply was down as one unit (Darlington 2) was out of service for the entire year due to refurbishment, but the units remaining online largely took up the slack as Bruce Power had record output, as did the set of 9 units at Ontario Power Generation which operated during 2017, and
  • for the first year since the system operator reported on their system's wind output, in 2006, it reported a decline (albeit a very slight one)
I didn't wish to dwell on numbers in this post. During 2017 I learned some new data reporting tools which I put on on a site where I invite data-gluttons to learn the filters and views to generate the typical year-end summary statistics, such as the total annual biomass generation for the past decade.
I do wish, in this post, to combine commentary to statistics to demonstrate very good figures from one perspective can have bad implications from a broader perspective. This is particularly important to note as the reasons rates didn't rise sharply in 2017 aren't sustainable.

Saturday, May 13, 2017

Fairly perverted: Ontario's "Fair Hydro Plan"

On March 2nd the Premier of Ontario introduced the "extend and pretend" plan to lower electricity rates for voters prior to the next election; on May 11th the government introduced its "Fair Hydro Act" bill shortly after the opposition Progressive Conservative's released an allegedly leaked cabinet document. The general content revealed contains some interesting details confirming what was suspected: the Premier's plan is cynical and irresponsible.

A quick refresher on events to date:

  • people are angered by electricity rates
  • there is an election in 2018
  • the Premier is unpopular
  • the Premier promised a 25% cut in rates.

Background:
On the original announcement in March: Extend and pretend: Ontario government acts to lower electricity bills 
This post will use some of the new material to emphasize why rates are high, what extending the payment period implies, and how the government intends on keeping the costs of the program off of the Province's balance sheet.


The Premier's "fair" plan isn't entirely about the cost of generation, although I'll concentrate on that. It includes moving some social costs off of ratepayers' bills and onto government expenditures, and abandons the provincial taxation share of the HST.  My reading of the new bill is that it mandates the reduction of Regulated Price Plan (RPP) rates be 25%. [1]

Now that we know the commodity portion of the bill is being reduced 25%, we can be more definitive about what is being subsidized, by whom, and the fairness of the policy.

Saturday, March 18, 2017

ON electricity pricing 1: retail math and green tales

It's not uncommon to hear a claim made that green energy can't be responsible for the steep increase in Ontario residential electricity rates because it's only around 10% of the total bill. This post could demonstrate calculations using 10%, but it is nearer reality to start with 15% in demonstrating why the argument deceives.

I disputed some claims by Environmental Defence a month ago, but I've used their figures in calculating 15% of the total bill. I did this by simply adding "conservation" in the calculations - while the report I criticized underestimated the cost of solar and (less so) wind, it overestimated the cost of conservation. Together these 3 would have been about 0% of bills a decade ago (2006), and in 2016 they were about 30% of the global adjustment, 28% of all Ontario supply costs (by the ED reports numbers), and since ED has that supply cost as 54% of a residential bill, they claim about 15% of the bill. 

Let's ease into some primitive math using figures we already know. How much does 54% of your bill need to increase for the total to move up 15%?
0.15 divided by 0.54 = .28.
There's the 28% increase in supply cost I noted in ED's figures. There's an assumption, probably incorrect, that supply was always 54% of the bill, but I'll keep things as simple as possible: a 15% increase in the total bill, all other things being equal, required a 28% increase in costs.

As wind, solar and conservation added negligible cost a decade ago, it's worthwhile asking how much spending in these areas increased overall electricity generation cost (ignoring the rest of the bill). It's not 28%:
1 divided by 0.72 (which is 1-.28) = 1.38888....
Costs are increased by 39% when adding new spending that then equals 28% of the new total.

Thursday, December 17, 2015

Losing time: everybody can't win Ontario's Electricity game

November's main electricity commodity rate in Ontario averaged $123.54/MWh, a full 10% higher than the previous record price. This post examines why.

Demand in November was very low, but almost identical to demand the previous month. The main electricity rate in Ontario is the Class B commodity rate comprised of the weighted Hourly Ontario Energy Price (HOEP) and the Class B global adjustment rate. It rose 23% from October to November. This makes a comparison of October and November very compelling.

The rate was the highest because data shows Ontario spent more on generation, and whatever else the system's operators felt related to generation, than any previous month.

There's been a lot of words about Ontario's electricity costs following the latest annual report from the Auditor General of Ontario, most from men in Ontario's electricity establishment claiming the female Auditor was unfair in noting the growth of the global adjustment. Today I am looking at the global adjustment only to estimate the total spend on electricity generation - and whatever else the system's mandarins feel is related to electricity generation - each month.


The graph's message is clear: total supply cost is rising. In November, Ontario spent more on electricity supply than ever before, despite demand levels near lows. Note the chart runs 49 months: November 2015 total supply cost is 53% higher than November 2011, while "Ontario Demand", as defined by the IESO, is down.[1] I don't want to dismiss the fact the price increase is seen entirely as a rise in the global adjustment, as that has very important cost implications in distributing system costs disproportionately across consumer segments. One result of growth entirely being in the global adjustment is the rise in the main, Class B, commodity rate is 77% over the 49 months - 24% higher than the increase in total systemic supply costs.

Why did the system's costs rise $240 million from October to November?

Monday, August 24, 2015

IESO Reporting Challenge: concerning Fig 23

Everything is political.

Working with data, the political introduces itself largely in reporting. The planning, structuring and collection of data all involve organizational power structures, but in an intelligent system all are dependent on operations and/or the current, or envisioned, demand for reporting.

I usually find reporting to be the least enjoyable aspect of working with data. Querying data can be very informative, and much of my writing takes one aspect of a data set and explores it with words. Reports are often designed for other people, to their design - particularly executive reporting, which is designed for a quick hit on the status presented in a format the executive are comfortable with.

The IESO eventually posted a report for June, weeks later than usual. That is interesting in itself, as it implies the report is designed for an audience the doesn't need it any particular time. I can't think of a benefit of variable intermittent reporting (VIR) in Ontario's electricity sector - must be part of a bigger trend to variable intermittent stuff.
Whoever the important audience is for VIR, the June report had at least one new graphic which must be for them:


This is not the format of reporting on generation I would expect the people reading through a summary report to find relevant. The IESO's long-standing Figure 18, "Monthly Energy by Fuel Type," is a graph of monthly production in the same stacked chart format, but for coherent categories; nuclear, hydro, gas/oil, solar, wind, biofuel and imports. I would think normal people looking at a monthly report might like cost information for the same categories they receive production information.
Like this:

Friday, April 27, 2012

Ontario replaces Independent: Weakly Electricity Sector Downgrades


I posted the latest weekly reporting figures this afternoon, and the data, fittingly, indicates a new record.  Week 16 is notable as the first week with Ontario demand growth over the previous year (Easter weekend was in 2011's week 16) - but the growth average for Ontario's demand was only 305MW/h, whereas the growth in net exports was 828MW/h.  The increase in net exports, combined with pricing remaining a third lower than in 2011, caused the export subsidies, by my estimation, to surge to record levels - for the third week in a row.

The Canadian Press shared this important bit of news this week:
TORONTO - Energy Minister Chris Bentley hasn't abandoned the idea of having a "real name" for the merger of the Ontario Power Authority and the Independent Electricity System Operator after all.
Bentley complained the energy sector is full of agencies known by acronyms like the OPA and IESO when he announced the planned merger of the two electricity planning agencies.
The minister said at the time he wanted the new agency to have a real name, but in legislation introduced today, it is known as the Ontario Electricity System Operator, or OESO.
In rearranging the Ontario Power Authority and the Independent Electricity System Operator,  Minister Bentley kept on 4 of the words: Ontario Electricity System Operator (OESO) is the working title.

Independent
Power
Authority

These words the Minister extinguished.

Thursday, January 5, 2012

My Pledge Suggestions

I subscribed to a e-mail from the Ontario Power Authority, which sent out some power saving tips for the 'festive season.'  As the owner of an old home (1907), here's a review of the their 'tips for the festive season"

• Replace old, incandescent holiday lights with LED lights. LEDs run much cooler, have lasting power and are energy efficient.
Depending on how many 10's of thousand of $s you have spent on upgrading your building envelope, be careful not to freeze to death by buying $30 lightbulbs because you don't realize the heat coming from the $1 lightbulb isn't doing much harm at all.


• Turn off outdoor holiday lighting before bed or use a timer to automatically turn them off when you go to sleep.
Put all your outdoor holiday lighting inside (see previous point)

Sunday, January 1, 2012

New Year, Same Stories, Old Professions


 Goodbye 2011.
This blog was new as 2010 turned to 2011. My first post of 2011 noted huge exports in December of 2010, negative pricing records for January 1, 2011, and record wind production in hour 21 of January 1st. It took about a week before the first reporter picked up on the subsidized exports story, which generated some interest in the mainstream media (MSM). Remarkably, in hour 18 of January 1st, 2012, wind would again set a production record (1633MW).

Comparing the immediately available data for New Years' Day 2012 to the 2011 data, we see why the price disaster of 2011 was curtailed, to only intermittent periods of negative pricing, this year.
Nuclear was idled: one unit at Darlington just for this weekend (we'll see if they get it back up for tomorrow's deep freeze), and one at Pickering they seem to have decided not to bother with this season (a Bruce A unit is also offline for a fairly substantial project).

Net Imports are only up compared to last year: 1/1/2012 we were still a net exporter - of over 1000MW/hour

Tuesday, March 29, 2011

Draft Response To Regulator's Consultation on TOU Pricing

2010-11 Time-of-Use Consultation (EB-2010-0364)

I’ve prepared some remarks as I consider a response to the Ontario Energy Board (OEB) review of the Retail Pricing Plan (RPP), and specifically the Time Of Use (TOU) pricing. 

Tuesday, February 8, 2011

Time-Of-Use Pricing

Time-of-Use (TOU) pricing is being implemented in Ontario.  This should provide the personal benefits of Ontario’s spending on smart meters.  More likely, it will result in the same efficiency gains we’ve seen on our bills from the rest of the smart grid initiatives (higher line loss factors added to our usage, and higher delivery charges in general).    Electricity policy encompasses issues of security, social responsibility, economics, politics, and environmental concerns.  TOU billing has implications for all of these things.   I won’t revisit the role of the OEB in protecting, or neglecting, the Ontario consumer – it’s in the smart meter column.  I will show TOU is limited in it's ability to alter Ontario's electricity supply - a supply that is being altered in a way incompatible with the intent of TOU as a demand management tool.

Friday, January 21, 2011

Smartiness: Smart Meters and Smart Grids Without Smarts

An article in Vancouver begins; “BC Hydro is proceeding on the premise that its $930-million plan to install so-called smart electricity meters for its 1.5 million customers will pay for itself through cost savings and not a rate increase, according to its business plan.”  The article explains, “savings are expected to come from the elimination of manual meter reading, reduction in electricity theft and more efficient usage,” and notes “savings are expected to come from the elimination of manual meter reading, reduction in electricity theft and more efficient usage."

My Ontario eyes were shocked.

They have business plans!

Wednesday, January 12, 2011

Much To Do About Nothing: Electricity Policy In Ontario


Something is bad.
Nothing is not.

This was a revelation for me. Nothing is what we all work towards. In the Ontario electricity industry of 2011, nothing drives everything. There are a number of laggards who fail to see the importance of nothing so, politically, the industry has adapted. There are ways to boast of doing nothing – generally by a flurry of feigned activity supported by measuring nought.
3 or 4 years ago I saw the long-term trend in Ontario Electricity consumption, from the Conservation Bureau. That was another revelation for me.

Thursday, January 6, 2011

Scott’s Submitted Comments on The Draft Supply Mix Directive

For anybody wishing to pursue commenting on the directive, or reviewing it, the online format is simply an online text box . The timeframe ends on January 7th . I therefore rushed this a bit, and didn't bother creating my usual, informative, graphics for the text box.

----------------------------------------


The combination of supply sources should be recognized as requiring expertise, and the Minister should be aware of his own limitations in directing electricity system engineers, and other professionals, in getting too specific. I would hope the intention of the Minister is to present the parameters for professionals to operate within.

-----------------