Friday, December 30, 2016

Nuclear Ontario - and giving electricity away

first posted on cold air currents.

Since I posted Reliable Electricity Generation Capacity declining in Ontario the IESO's NPCC 2016 Ontario Interim Review Of Resource Adequacy was published.
It's exciting stuff:
The Independent Electricity System Operator (IESO) submits this assessment of resource adequacy for the Ontario Area in accordance with the NPCC Regional Reliability Reference Directory #1, “Design and Operation of the Bulk Power System.” 
Spoiler alert!
The report concludes Ontario's system can meet Loss of Load Expectation (LOLE) criteria for the 2017 to 2020 planning period once Emergency Operating Procedures (EOP) are assumed. EOPs are indicated to be essentially 1/3rd public appeals to reduce consumption, and 2/3rds voltage reductions.

Phewff.

I wrote "With the exception of 2013 the capability at peak has declined every year since 2010, despite IESO-connected generator capacity being greater now than it was six and a half years ago," so I thought it only fair I offer a brief analysis of how the IESO is meeting the reporting requirements for resource adequacy - and the repercussions of how they are doing so.

Wednesday, December 21, 2016

Historical ignorance: on energy losses in decadent Ontario


Accusations of losses on electricity exports, and government denial of the fact, is far from news, but the reappearance of the topic in Ontario's legislature demands it be reviewed anew.
Progressive Conservative Leader Patrick Brown says the province sold $9.4 million worth of excess electricity for just $144,000 on Nov. 10...
Brown says Ontario has "given away" $6 billion in surplus electricity since 2009 by selling it at a big loss...
Energy Minister Glenn Thibeault...says Ontario made $230 million in 2015 by selling excess electricity to neighbouring jurisdictions.
Thibeault says Ontario suffered through power shortages and brown outs when the Conservatives were last in power, and had to spend up to $500 million a year to buy electricity from its neighbours to keep the lights on.
   -the Canadian Press via ctvnews.ca
I wrote on the costs to Ontario ratepayers of cheap exports almost 6 years ago, in rebutting the same spin as the Minister delivered yesterday when presented by a previous Premier. Later, in 2013's Ways to estimate Ontario's losses on electricity exports I demonstrated multiple methods to quantify losses on exports. The estimates of losses vary by methodology and assumptions, but if methods are applied consistently all indicate increased costs to Ontario consumers from producing far more electricity than necessary to meet their demands .

I won't revisit all the arguments I've made in the past, but instead tailor a response to the rookie Minister's old denials, emphasizing how poorly he is prepared to undertake the task of developing a plan for the sector.

Sunday, December 18, 2016

Reliable Electricity Generation Capacity declining in Ontario

Ontario's electricity sector provided some material worthy of commentary over the past week.

A new 18-month Outlook issued by the IESO (the province's system operator) begins cheerfully enough:
The outlook for the reliability of Ontario’s electricity system remains positive for the next 18 months, with adequate generation and transmission to supply Ontario’s demand under normal weather conditions.
This is reassuring - unless there's a particularly hot run of weather:
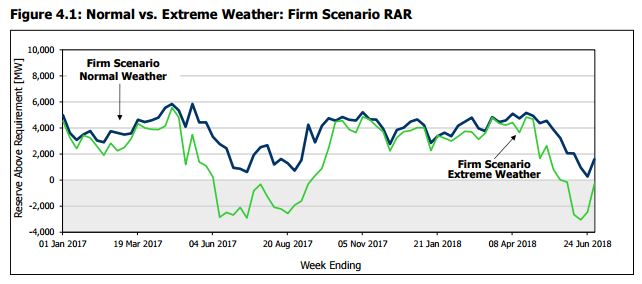
Under extreme weather conditions, the reserve is below the requirement for 19 weeks over the entire Outlook period, with the largest shortfall being approximately 3,000 MW.
19 weeks in 18 months is 24% of the time - corresponding with the quarter of the year known as summer. In a province introducing carbon pricing in January (poorly), apparently the government is unconcerned about local warming.

firmscenario

There has been similar language in previous 18-month outlooks:
During the Outlook period, the...forecasts show that Ontario’s available generation exceeds projected demands...there are periods when Ontario’s available reserves are forecast to be ...below the IMO’s required planning reserve levels.
That from the Outlook produced in April 2002.

I'm sure today's Wynne government finds comfort in how well Ontario's system coped with heat waves in 2002 and 2003 - despite their braying indicating the opposite.

Wednesday, November 30, 2016

Ontario Energy Minister Previews Long-Term Energy Plan Themes

"I've really come to respect the enormous complexity of the energy and electricity system in Ontario."

Ontario's rookie Minister of Energy, Glenn Thibeault, is now confident enough of his grasp of the province's energy system that he unveiled themes for an upcoming Long-Term Energy Plan in a speech to the Empire Club:
  1. Nature and style of procurement should be technology agnostic
  2. Ontario's electricity market renewal/reform to provide better value
  3. Empowerment of consumers
These are ambitious themes. Unfortunately Minister Thibeault didn't display an understanding of the institutional barriers to change, and he's going to need to confront the demons of the sector before meaningfully advancing any of these goals.

He seems to expect the barriers to deliver change.

Tuesday, November 22, 2016

something about electricity rates: the Premier's mistake

Premier Kathleen Wynne is calling high electricity prices her “mistake,” begins a report on her speech at the Ontario Liberal Party's annual general meeting. The statement would appear sincere if accompanied by an explanation of exactly what she thought her mistake was. As a political tactic, as I think it is, it's a good move in positioning the Liberal party for the election coming in 2018.
...a contrite Wynne told 850 Liberal delegates at the party’s annual general meeting here that her “government made a mistake” by allowing rates to soar.
“It was my mistake and I’m going to do my best to fix it,” she said...
Tactically, I think the move is based on two things:
  • the political rule that the electorate's anger is not sustainable
  • most expensive electricity contracts have now entered service and, combined with OPG's poor rate application, upward pressure on rates was, and is, planned to be less severe over the next couple of years.
These realities may allow the Premier to now position herself as responsive to people concerns. Adrian Morrow's report shows how she'd like to end up positioned for the 2018 campaign:
“I will do my very best to listen, to respond, to lead, and to serve you and the people of Ontario better,” she said. “I will be right there with you: As premier, as leader, I’ll be there with you as Kathleen, a proud mother and grandmother.”
These are the factors that put some wind in the sails of Wynne's Liberal ship. An article by Robert Benzie notes some of the content presented to the assembled Liberals by master strategist and Liberal campaign chief David Herle:
Even though [opposition leader] Brown publicly broke with social conservatives in August — saying he supports abortion rights, same-sex marriage, and the modernized health lesson plan — Herle’s findings suggest the Liberals plan to paint him as one.
Simply put, the Ontario Liberal Party is positioning the party for a culture war - with a caring grandmother running against a jerk.

It's a promising but risky tactic.

Wednesday, October 26, 2016

Ontario Electricity – The Liberals Giveth and Taketh Away

This is a guest post, by Bruce Sharp.
The post first appeared on Linkedin.

Ontario Electricity – The Liberals Giveth and Taketh Away

The big energy splash in the Ontario Government’s September 12 throne speech was rebating the provincial portion of the HST to certain electricity users. This group will include mainly voters and is estimated to cost about $ 1 billion per year, with the cost being born by provincial taxpayers. In a September 14 Linkedin post, I commented on the merits of the move.

Another electricity move announced that same day was the expansion of the Industrial Conservation Initiative (ICI), otherwise known as the Global Adjustment (GA) Class A.

Ontario’s GA is the electricity market mechanism for collecting and allocating above-market generation and conservation and demand management costs. Prior to 2011, there was a single GA class, with all consumers paying for GA costs based on a uniform, postage-stamp rate. Starting in 2011, we had two classes: A and B, with the classes’ shares of GA costs determined in different ways. This program did not initially have a name but at some point was dubbed the Industrial Conservation Initiative. Class A now pays significantly less than they would have, had we still had one GA class. The result is a transfer of costs from Class A to Class B, i.e. a cost decrease for Class A’s mostly large industrial consumers and a cost increase for Class B -- residential and most other Ontario electricity consumers.

In an April 14 Linkedin post, I provided an update on that cost transfer. Given the recent news, I thought I’d provide another update, estimate the additional transfer that will occur as a result of the expansion of Class A and look at the economics of the initiative.

For the period of October 2015 through September 2016, total GA costs were $12.1 billion. If there had still been a single GA class, the uniform rate would have been $ 86.20/MWh.

With the two classes, there was a cost transfer from Class A to B of $ 940 million. Class A paid an average of $ 52.50/MWh or 39% less than they would have had we still had a single GA class. Class B -- by virtue of its larger total energy consumption -- paid $ 94.60/MWh or 9.7% more. For the residential consumer with losses-inclusive, annual consumption of 9.5 MWh, that represents an added cost (inclusive of HST) of $ 90/year.

The expansion of Class A will take place either July 1, 2017 or July 1, 2018. One source I’ve spoken to says the government will want to do this sooner rather than later. It will likely involve removing baffling restrictions to the 3 – 5 MW eligibility and a reduction of the overall average monthly demand threshold to 1 MW. A thousand businesses are to be newly eligible,

The result will be an additional cost transfer – from the new Class A consumers to the remaining Class B consumers.

How much will it be?

Sunday, October 23, 2016

Fixed: Ontario's electricity relationship with Quebec

Ontario's government, keen to appear responsive to public anger at electricity pricing, has announced an agreement to fix one aspect of the supply system currently working well.

Ontario and Quebec announced an electricity agreement guaranteeing Ontario 14 million megawatts-hours of imports from Quebec over the next 7 years. Compared to Ontario's other electricity contracts, this deal looks attractive at first glance. Looking closer the deal is less attractive,and putting the deal in the context of Ontario's move away from public power, at cost, to what was intended to be a competitive market system, it may be the most ridiculous contract of all.

The agreement, according to Ontario's press release, is for:
  1. energy capacity,
  2. trading electricity, and
  3. energy storage.
All 3 aspects of the agreement exist already, due to the realities of electricity supply and demand in the two provinces, and previous initiatives connecting the systems.

The capacity arrangement, securing rights to supply for peak demand hours, is technically convenient. Quebec has a very high winter peak demand, due to electric heating. They have a system designed to do that - but more capacity on the coldest days is desirable. Ontario's demand peak is usually in summer - and more capacity for that is desirable. Since April 2011 I've captured hourly intertie movements - and looking at each subsequent season's top 10 daily peak hours, its evident Ontario is a net importer from Quebec during the highest demand summer days, and usually an exporter during the highest demand winter days. While this relationship has existed, and would continue to exist, without an agreement, there are capacity reserve tests requirements enforced by the North American Electric Reliability Corporation (NERC), and this formal agreement should be useful in meeting those requirements.


Increased electricity ties with Quebec have long been recognized as having benefits. Significantly, late in 2006 an agreement was made to expand the connections between the two provinces by 1,250 megawatts, and the completion of the work allowed for greater trade by 2009.

Monday, September 12, 2016

Communication, Politics, Money: Wynne's electricity/electoral strategy

The Premier of Ontario launched a campaign advertising her concern about the impact of high electricity rates in proroguing the legislature, which allowed for a New Speech from the Throne setting government priorities. The speech announced a new policy for residential electricity consumers, re-implementing an old policy but providing an excuse to discuss the communication strategies impacting the electricity narrative in Ontario - among the political parties, and allegedly public servants.

A brief reverse timeline on tax policies and electricity in Ontario:
  • September 12, 2016 the Wynne government announces the provincial portion of the Harmonized Sales Tax (HST) will be rebated on residential and small business consumer bills as of January 1, 2017;
  • January 1, 2015 the Wynne government removes the Ontario Clean Energy Benefit (OCEB) that deducted 10% of residential electricity bills
  • January 1, 2011 the McGuinty government (same party) introduced the OCEB
  • July 1, 2010 the McGuinty government adds 8% to residential electricity bills when the Provincial and Federal sales taxes are harmonized as the HST
Let's not pretend that today's announcement is creative or terribly meaningful, but uncover the limitations that prevent the Premier from doing something meaningful to control costs - or allow her to let rates rise higher.

David Herle is an influential political strategist notable for co-chairing the Premier's successful 2014 election campaign. In February (2016) Mr. Hearle delivered a presentation to the Canadian Nuclear Association (CNA). The first point Mr. Hearle had on his slides was:
Rates are an increasingly major concern in Ontario. The cost of electricity is not just seen to be unreasonably high, it is widely seen as damaging to the provincial economy. 
  • Slowing rate increases is critical. 
  • Electricity is a necessity not a luxury.
A conservative strategist, Nick Kouvalis delivered a similar presentation to the Ontario Energy Association in the fall of 2015. That presentation also showed survey results indicating economy and jobs topped concerns, with energy prices not far behind.

Mr. Hearle noted some characteristics of public opinion that now drive Ontario Liberal Party public speaking on electricity. People like:
  • the elimination of coal
  • improved reliability
  • conservation
  • renewable energy (many remain positive on industrial wind - and most on solar)
Hearle, it seems to me, indicates a communication strategy that recognizes people don't want to blame cost hikes on things they like, and therefore Liberal policy is to challenge people to associate increased rates to the achievement of outcomes they desired - specifically coal's elimination in the generation of electricity, and alleged improvement to system reliability.1

Saturday, July 23, 2016

The growing subsidy of wind and solar in Ontario

I was recently asked the amount of subsidies paid to wind and solar generators in Ontario, and felt answering deserved a blog post. I will show that from the introduction to Ontario's transmission grid of the first industrial wind turbines in 2006 up to June 30, 2016, subsidies to wind and solar generators have been approximately $6.4 billion.
More important than the figure, are the trends in annual magnitude and composition.

I have tried not to use the word "subsidy" in recent years - having been guilty of using poorly in the past. However, it's increasingly clear to me that avoiding the "subsidy" discussion has been harmful to Ontario's ratepayers.

In Ontario the word "subsidy" is often quantified by the amount paid for electricity by consumers above the price of that electricity in Ontario's market. The method of recovering that amount is the global adjustment mechanism. The complicated system with huge figures (on track to hit $12 billion in 2016) meant great attention was paid when the Auditor General of Ontario reported, "[from] 2006 to 2014, electricity consumers have already paid a total of $37 billion, and they are expected to pay another $133 billion in Global Adjustment fees from 2015 to 2032." 


However, with all generators in Ontario now recovering some of their costs outside of the market rate, the global adjustment has become a poor tool for defining subsidy. Treating the global adjustment as a subsidy ignores that Ontario's weak electricity market isn't intended to recover all the costs of generation. When the market functions to provide any indication of generator cost, it is usually only the fuel portion of a natural gas-fired generator's expenses. This makes the global adjustment a poor definition of a subsidy - although it's a fine indicator of the poor quality of Ontario's electricity market.

Sunday, July 10, 2016

New wind study provides a good argument for nuclear power

Last Wednesday I posted my critique of a wind-water-sun (WWS) fantasy for Canada, which unknowingly coincided with the Canadian Wind Energy Association (CanWEA) release of a Pan-Canadian Wind Integration Study (PCWIS) 1. The PCWIS, primarily prepared by a branch of industrial wind turbine manufacturer General Electric, contains statistical work that should be of interest to those looking at capacity valuation, and its impact on electricity supply mixes. However, the basic data discipline indicated by the study is poor. Unfortunately a rather deep read of PCWIS is necessary to realize how unimpressive the expected impacts of adding industrial wind to Canada's generation mix are.

The main conclusion of the study is that building out the wind industry in Canada does very little to reduce greenhouse gas emissions in Canada.


The study was mostly paid for by Canadian taxpayers via Natural Resources Canada:
 "The project’s primary goal was to obtain insight into the challenges, opportunities, mitigation measures and operational tools needed to efficiently integrate wind energy into the grid. This has been accomplished by undertaking an integration study approach, which involves matching time series modelled wind energy production data with electricity demand data, and evaluating how this influences the rest of the electricity grid."
I'll evaluate the data work for Ontario, although some claims the study makes for other provinces also demand comment.

Wednesday, July 6, 2016

Wind Water and Sunlight: Jacobson's sorcery

Dreams of a future powered by wind, water and sunlight (WWS) have been spread by Stanford professor Mark Jacobson. Jacobson's work is more optimistic about the contributions to come from WWS than other projections, which may explain an infectious political appeal. In my country the allure of a WWS power supply is impacting Canada's most left political party, the NDP.

SK Premier Wall and Lead Leaper Klein exchange tweets
I've looked at the the WWS work and will demonstrate its shortcomings in Ontario, with the expectation that can be extended to all northern jurisdications. One inspiration for looking at the viability of WWS is opportunistic: Ontario, with a new Minister of Energy, is initiating another Long-Term Energy Plan (LTEP) process. The WWS work provides a test case to run through a data model I created for the previous LTEP planning, and refine my work as necessary.

I won't concentrate on Jacobson's work to nearly the extent of Jani-Petri Martikainen's convincing and entertaining Why does Mark Jacobson hate Finland? or multiple insightful articles at the "A Chemist in Langley" site, including the most recent, Debunking the Leap Manifesto’s 100% Wind, Water and Sunlight Annual Energy, Health, and Climate Cost Savings. I'll attempt to limit myself to briefly discussing how the WWS paper arrived at its supply mix for Canada, and testing that mix within an hourly model - the only way a mix can be rigorously tested.

The April 2016 draft paper from Jacobson and others, 100% Clean and Renewable Wind, Water, and Sunlight (WWS) AllSector Energy Roadmaps for 139 Countries of the World, concluded, "The study finds that the conversion to WWS is technically and economically feasible. The main barriers are still social and political." It's a grand claim for a draft exercise that claims only to,
"[calculate] the number of generators of each type needed to power each country based on the 2050 power demand in the country after all sectors have been electrified but before considering grid reliability and neglecting energy imports and exports."
WWS does not present itself as attempting any hourly modelling of an electricity system, building requirements solely based on total energy requirements for a calendar year.

Sunday, July 3, 2016

Ontario's electricity sector performance halfway through 2016

The year-to-date average unit cost for electricity for the typical Ontario consumer (class B) is up 16% from a year ago, while the average market rate (weighted) dropped to only $12.03/MWh.

I've posted less than usual thus far into 2016, but spent more time on database work and related pages at my data site. A lot of that work is for myself, allowing me to take in the latest data in a scroll through a weekly, or monthly, report, but I thought I'd use the halfway mark of 2016 to pull some interesting statistics together that I hope will communicate why I added some graphics, based on more speculative data, to those reports.

If you follow only the numbers the IESO (Ontario's system operator) features on its website, you would find the first six months of 2016 had the lowest total "Ontario Demand" on their records - even using meter data they've made available going back to 1994.


The record low "Ontario Demand" figure is of little real importance, but is useful in illustrating the changes to Ontario's electricity sector. The IESO's "Ontario Demand" is the generation from the suppliers in its system, including generation lost on transmission lines and the consumption of generators themselves. It does not include generation with local distribution systems, and that is the generation growing within Ontario - lessening "Ontario Demand". Better estimates of actual consumption of electricity in the first half of 2016 was down from the same period in 2015 (which was colder - and 2014's winter was colder again), but I find 2016 about equal to consumption in the first half of 2009 through 2013.

Thursday, June 23, 2016

The declining capacity value of solar in Ontario, and beyond

A solar panel added to Ontario, today, has a capacity value of less than 6% and the reality is if solar continues to be added peak requirement for new supply will move to winter evenings and instead of new solar’s capacity value being close to nothing it will be absolutely zero.
I wrote that yesterday and, inspired by an exchange on Facebook, want to support the statement, add industrial wind to it, and argue the relevance of the statement not only to Ontario, but in California where the claim is a nuclear power plant can be closed and the output replaced with negawatts/efficiency/conservation, solar and wind.

Electricity supply is of value to a system in multiple ways. The two I examine are basically the actual watt-hours of output (I'll call this "energy value", and the ability to produce the output when demand calls for it (this I will call the "capacity value"). 

The diminishing value energy value of intermittent generation should not be well known. I was excited to write on the decrease three years ago, but a current work from Lion Hirth (and Simon Müller) explains well why now seems obvious:
In hours of high wind speeds, the additional supply of electricity from wind turbines depresses the price below the level it would otherwise have been. This price drop is greater, of course, when larger amounts of wind power are installed, a phenomenon that has been described as the “self cannibalization effect” (a dramatic term for the simple consequence of increased supply). As a consequence, the market value of wind power declines with its market share.
This post will deal only with "capacity value".

Additional solar, and wind supply, have lower capacity value today because the operator of Ontario's electricity system, the IESO, released an updated outlook showing the capacity of solar panels connected to the IESO's system grew by 240 megawatts (MW) over the past 12 months, but the IESO expected only 14 MW of production from that capacity during the peak demand for generation. Dividing 14 by 240 gives a measurement for the capacity value, of 6%.

Less notably, but likewise moving lower, industrial wind turbine capacity increased 898 MW, with only 105 MW more output expected at peak demand. That's a capacity value of 10.4%, and as with solar, it's worth stressing those are the IESO's numbers, not mine. I'll address whether those figures are valid in a future post.

The reason for the decline is the expected hour of peak demand has moved later in a summer's day. The reason for the move is not a changing consumption patterns, but changes in the electricity supply mix. While this doesn't change the valuation story, it does require some explanation.

Monday, June 20, 2016

OPG's application to hike nuclear power rates harms credibility

The average cost of power from Darlington nuclear units post-refurbishment is estimated to range between $72/MWh and $81 MWh, or 7 and 8 cents per kilowatt hour.
So announced the Ontario government in a January 11th, 2016 news release.
137 days later Ontario Power Generation (OPG) filed an "Payment Amount for Prescribed Generation Facilities" application with the Ontario Energy Board, asking for rates for supply from its nuclear generators to rise to $99/MWh by 2021.
data from OPB_Exl1-1-1_Att1_OPG_RevenueRequirement Work Form_20160527.xlsx filed at OEB
I find the rate application disheartening.

Anti-nuclear forces will find it very useful.

Wholesale reporter Keith Leslie wrote of "a whopping 69 per cent increase...over the next five years" with quotes from his standard go-to Jack Gibbons, who just days earlier had an editorial in the Toronto Star arguing for the closure of the nuclear reactors at Pickering using some of the same arguments he had discredited 2 years ago (by me in June, and by the IESO/OPA in October), and some other sound-bite emotive appeals developed in the 1970's. [1]

Which doesn't mean Pickering shouldn't be closed.

Having a better record with OPG's financial arguments than they themselves do, I feel obliged to see if OPG's management was just inept in formulating a rate hike that I suspect more likely to scuttle the refurbishment of Darlington's reactors than extend the life of Pickering's, so I'll explore the production and revenue requirement totals with some historical context, and review the poorly chosen "smoothed" option.
This rate hike request reveals some things about what OPG has become, and also reveals shortcomings of the Ontario Energy Board (OEB) in regulating Ontario's electricity sector.

Monday, May 16, 2016

Waste Deep in the Nipigon

Ontario increasingly wastes electricity.

Wasting electricity is nothing new. I have a recurring earworm originating in a 1970's Ontario Hydro advertising campaign; "wasting electricity turns people off." In the decades since we are often reminded we use the wrong light bulb, the phone charger wrongly, water stupidly, and on and on. But today's waste includes actually curtailing emissions-free generation, without consumer savings, simply because there aren't consumers that can use the electricity. Much of that waste is avoiding generation from the public hydro-electric generation that gave the former  public utility the name "Ontario Hydro." Ontario Hydro is gone, but it's generators survive under Ontario Power Generation (OPG). I present OPG's generators on the Nipigon river as an example of the waste occurring in today's IESO administered electricity system.

The Nipigon river was in the news this winter as a new and unique, to the climate, cable-stayed bridge heaved, closing the TransCanada highway to all traffic for days, and requiring heaving loads to drive around Lake Superior for a much longer period. The bridge design was selected, at least in part, as it "eliminates the need for in-water structures in the Nipigon River."

15 kilometers (km) away, the Alexander Generating Station is an in-water structure that first started producing power in 1930. The current capacity is 69 megawatts (MW).

2 km upriver of that is the older Cameron Falls Generating Station, with a capacity of 92 MW.

OPG's Pine Portage Generating Station
17 km upriver of that is the newest, and largest of OPG's Nipigon River system generators, the 144 MW capacity Pine Portage Generating Station. A substantial reservoir exists behind Pine Portage:
Forgan Lake, south of Lake Nipigon, was created when Pine Portage was built. Forgan Lake was named by a decision of the Canadian Board of Geographic names on November 3, 1949. The lake comprises Hannah Lake and Creek, Eva Lake, Pine Point, Devil Rapids, Victoria Rapids, Emma Lake and others.
Conceptually, the same water provides electrical power 3 times, with it's journey through all three generators controlled at Pine Portage.

I've been tracking hourly generation reported by the IESO since September 2010.[1] To eliminate the typical monthly variations over the course of a year, I've graphed the moving 12-month total of each of OPG's 3 Nipigon River generators:


The decline of production at the Pine Portage generating station is obvious, and so dramatic in recent months I asked OPG on twitter if they, "would like to comment on reduced production at Pine Portage GS before I speculate." OPG responded, "Pine Portage GS is available to run if required. Suggest you contact @IESO_Tweets for demand information."

Tuesday, May 10, 2016

Ontario appeals court upholds sentence of higher costs for ratepayers

The Ontario Court of appeal recently upheld a ruling adding over half a billion dollars to Ontario's electricity bills.[1] The case involved a number of electricity generators contracted between 1989 and 1994 challenging a 2011 change in the method of calculating a benchmark to which payments are indexed. Officially the generators' challenge is against the Ontario Electricity Financial Corporation (OEFC). Functionally, it is ratepayers that were punished. How ratepayers came to be guilty is a legal matter, but the failure in court is a result of the failures of the province's recent governments.

The generators were contracted during periods of Liberal (David Peterson) and New Democratic Party (NDP) rule. Neither party was positive on the public electricity entity, Ontario Hydro, and its concentration on nuclear power. Ontario Hydro was forced by the governments to contract supply from "non-utility generators" - now simply called NUG's.

The court documents reveal a group of NUGs contracted with pricing indexed to "Direct Industrial Customers ...whose average monthly maximum demand was 5 MW or greater." An additional and pertinent specification in the indexed model is "a 100% load factor, meaning a constant and consistent energy demand for all 8760 hours of a year."[2] 

The court's ruling, upheld on appeal, is that the NUGs getting paid based on,via indexing, a current industrial customer with monthly peak demand greater than 5 MW with, a 100% load factor, is unfair.

That's a suspect decision, but worse is the direction to revert to the previous methodology.

Sunday, April 17, 2016

10700: Ontario's beastly number

Planning Ontario's electricity sector should have been a topic of interest when, on December 2nd 2015, the province's Auditor General included a chapter on Electricity Power System Planning in her annual report. The report received a lot of attention, but our power system planning process did not. The fall of the arbitrary, yet long-standing, 10700 megawatt target for non-hydroelectric renewable energy would indicate a return of professionalism in planning Ontario's electricity sector.

Before 10700 was the Integrated Power System Plan (IPSP) process.

The Liberal government, elected in the fall of 2003, had created the Ontario Power Authority (OPA) largely to develop an IPSP professionally, if not entirely independently. The process had, in its early stage, the OPA prepare supply mix advise for the Minister of Energy. Some notable aspects of the December 2005 advice:
  • Preference for renewable sources of energy...
  • Renewables, including wind, small hydro (waterpower) projects and hydro purchased from other provinces (referred to as “hydro imports” in the balance of this report), can provide a significant share of capacity and energy...
  • ... conservation and new renewable sources would more than meet all of Ontario’s growth in demand for electricity by 2025. This would not, however, replace the loss of capacity from the retirement of other supply sources...
  • Together, natural gas and renewable sources can replace coal generation...
I've added emphasis, but quoted from the OPA verbatim.
The OPA suggested to the Minister that by 2025 "renewables" be 15,500 megawatts (MW) - inclusive of about 8000 MW of existing hydro capacity and most likely the 1,250 MW increase in the Ontario-Quebec intertie capacity. [1]

Six months later, in June 2006, a Supply Mix Directive from the Minster tasked the OPA with the development of an IPSP (plan) including:
Increase Ontario's use of renewable energy such as hydroelectric, wind, solar, and biomass for electricity generation. The plan should ... increase the total capacity of renewable energy sources used in Ontario to 15,700 MW by 2025.
The IPSP final form, delivered August 29, 2008, planned for 16,164 MW of renewables by 2025: 10,768 MW of hydroelectric, 4,251 of wind, 656 of bioenergy and 488 MW of solar. [2]


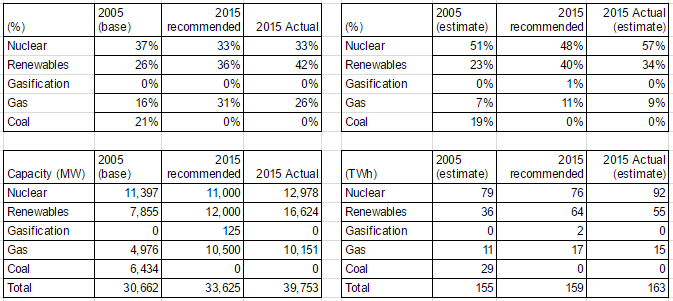
opa2005to2015actComp
Spreadsheet comparing OPA Supply Mix Advice from 2005 to estimated actual 2015 data.
1st posted in Reviewing a 2005 plan for Ontario’s electricity supply in 2015
19 days later, on September 18th 2008, a Minister of Energy and Infrastructure essentially killed 3 years of work with an unintelligible directive amending the 2006 Supply Mix directive.

Wednesday, March 30, 2016

Ontario's curtailed wind energy

Ontario's electricity system operator, the IESO, recently released multiple reports including a summary page for 2015's supply now inclusive of "dispatched down" data for industrial wind turbines (in the same format as their 2014 summary). This is the one instance during a year I can compare my estimated curtailment the IESO's reported curtailed wind supply. This year there are similarities, such as the wind curtailments significantly increasing, and there are differences, which I've used to adjust my methodology for estimating hourly curtailments.

The IESO data is not a comprehensive curtailment report. By "curtailment" I mean supply which is rejected by the IESO through any process. My definition includes Ontario Power Generation (OPG) hydro. OPG reports:
During each of 2015 and 2014, OPG lost 3.2 TWh of hydroelectric generation due to SBG [surplus baseload generation] conditions.
For both years, the OPG hydro losses double the amount of curtailment the IESO shows for the combination of "nuclear reductions" and "wind dispatched down."

Thursday, March 10, 2016

The cost of ending coal-fired generation, and renewables, in Ontario

Ontario stopped getting electricity from burning coal at the end of 2013. The coal exit is one element of Ontario's electricity system gathering attention from other jurisdictions, along with a very low greenhouse gas emissions intensity, the fastest growing (and possibly now the highest) rates in continental North America, and a high level of resistance to new generation from local residents. It might be logical for outsiders to associate the steep rise in the price of electricity as the cost of getting off coal, but that has not been the major factor pushing up rates.

Bruce Sharp, an energy analyst I greatly admire, recently produced Ontario Electricity - the Cost of Coal Replacement, which put some numbers up against an Ontario government document on The End of Coal. That document is not the proper starting point for evaluating the cost of ending coal, but Sharp's methodology for pricing provides a useful foundation to build an analysis upon.

table from Bruce Sharp's Ontario Electricity - the Cost of Coal Replacement

4,000 megawatts of wind, and 1,500 of solar, were not part of the plan to replace coal. I've previously demonstrated added natural gas and nuclear generators compensated for the removal of the coal-fired power plants.
Graphic from January 2013 post - data in this spreadsheet
Upon reflection, I think the proper starting point to evaluate the cost of exiting coal is June, 2005 - and it can include some wind. The elimination of coal was a 2002 recommendation of  an "all-party Select Committee on Alternative Fuel Sources", carried in the platforms of the three major parties into the 2003 election. That election was won by the party promising to eliminate coal by 2007 (not 2015 as the all party committee had recommended) - but they weren't succeeding in that goal, so in 2005 they released more specific plans described in this press release:

Friday, February 12, 2016

Eating wind: Carbon capped opportunity Part 2

Reading Rooftop coal: Carbon capped opportunity Part 1 will benefit readers of this post

There's a message being spread about Ontario that the expensive, but low carbon emission, electricity it produces will soon be worth big bucks due to the proposed Clean Power Plan in the United States - and trading of emissions. This was implied by one member of the Climate Action Group on television recently (I wrote on the program), and quickly expanded upon in into an article in The Toronto Star:
... the country’s power sector is prepping for a dramatic increase in U.S. demand for clean electricity.
Action on climate change is the reason — more specifically, U.S. President Barack Obama’s Clean Power Plan, which aims to slash carbon dioxide emissions from power plants by a third by 2030.
The plan is expected to triple the flow of Canadian electricity into Midwestern and northeastern border states, part of a broader U.S. effort to comply with the international climate obligations that 196 countries agreed to in Paris.
...
The North American Electric Reliability Corporation [NERC], which monitors and regulates grid stability in Canada and the U.S., estimated in a report last April that net Canadian electricity exports under the Clean Power Plan could grow three-fold between 2020 and 2030 as demand for renewable power grows in states such as Ohio, Michigan, New York and jurisdictions in New England.
Here we have the agreement from Paris and the U.S. Clean Power Plan discussed, so I'll briefly discuss each to communicate the value for Canada, and particularly Ontario, is limited - but an opportunity does exist.

The most relevant quote for the Paris deal comes from The New York Times' Coral Davenport back in August 2014:
...President Obama’s climate negotiators are devising what they call a “politically binding” deal that would “name and shame” countries into cutting their emissions.
...Countries would be legally required to enact domestic climate change policies — but would voluntarily pledge to specific levels of emissions cuts...
That "name and shame" strategy was advanced in Paris, primarily because the President lacked the ability to have Congress pass anything legally binding. Countries provide plans for reducing emissions, and if they don't achieve them they will be mocked by countries that are achieving their goals, should there be any.

The U.S. Clean Power Plan, if it gets enacted, will offer states a couple of methods to comply with individual emissions targets based on a subset of generators operating in the states in 2012 (I'd need to check in the volumes of text to confirm the base year) - the subset exclude generators without emissions in service prior to 2013 (most notably nuclear); it therefore basically includes almost exclusively emitting facilities.
States can target either emissions intensity, getting facilities to an average of ~20% below the intensity level of the 2012 base year (so replace coal with gas, of augment coal with wind, etc.), or they can just reduce their emissions by the requisite amount (it varies by state). Those sound the same, but the first option could actually see increased emissions. Illinois, for instance, could likely replace older nuclear units with natural gas generators and easily meet clean power plan targets by doing so.
Emissions reductions can come in state or not - by power purchase agreements with facilities outside of the state, or through the trading of cap space (such as through clean energy certificates).

How does this impact Ontario?
___

The North American Electric Reliability Corporation [NERC] reference in the Toronto Star article is probably Potential Reliability Impacts of EPA’s Proposed Clean Power Plan: Phase I, which does show a forecast where:
"Canada exports three times more power to the United States, mainly NPCC and MISO North."
NPCC is the Northeast Power Coordinating Council and it includes Canadian provinces/systems east of Manitoba as well as the New England and New York system operator areas (NYISO and ISONE).

The NPCC jurisdictions don't import much more juice in the NERC work:
graphically edited to most relevant data from NERC "Potential Reliability Impacts of EPA's Proposed Clean Power Plan
The "MW Interchanges No CPP" indicates, for Canada, net exports of 5,461 megawatts on average if the Clean Power Plan doesn't come into force, which works out to an annual total of about 48 terawatt-hours (TWh), and that is the average that actually occurred from 2012-2014. The best case (State level application of the Clean Power Plan) offers an export opportunity into New York and New England systems of another 691 megawatts on average, but that's little more than Ontario wasted in 2014 as generators reportedly curtailed an average of ~550 megawatts (by way of annual totals of 376 thousand MWh of wind, 1.2157 million MWh of nuclear and 3.2 million MWh of hydro-electric power). The NERC document that enthused Tyler Hamilton writing in the Star doesn't offer much hope for the U.S. northeast bailing Ontario out of its over-supply.

Rooftop coal: Carbon capped opportunity Part 1

Big topics are converging as Toronto's spinners, enthused by a new power in Ottawa, work a yarn to justify raising revenue for the government and to gloss over the massive waste in the electricity sector since 2008.
This post is longer than usual, so it is presented in two parts. My intent is to discourage contracting more excess electricity supply in Ontario, and to demonstrate a limited opportunity to steeply reduce losses on existing contracts

Climate change has been called a wicked problem, but that's usually ignored when tidy, if false, solutions get presented.
Two of those solutions are Cap and Trade everywhere, which is of particular interest to Ontarians now, and the U.S. Clean Power Plan -which Ontarians are getting told they might benefit from.

The editorial board of the New York Times has declared Proof That a Price on Carbon Works:
Lawmakers who oppose taking action to lower greenhouse gas emissions by putting a price on carbon often argue that doing so would hurt businesses and consumers. But the energy policies adopted by some American states and Canadian provinces demonstrate that those arguments are simply unfounded.
Around the world, nearly 40 nations, including the 28-member European Union, and many smaller jurisdictions are engaged in some form of carbon pricing. In this hemisphere, British Columbia, Quebec, California and nine Northeastern states have raised the cost of burning fossil fuels without damaging the economy. Alberta, Canada’s biggest oil and gas producer, and Ontario have said they will adopt similar policies.
...British Columbia, which is home to 4.7 million people, has placed the highest price on emissions in North America, taxing a ton of carbon emitted at 30 Canadian dollars, or about $21. By comparison, emission permits in California and Quebec are trading at about $13 a ton. And permits sold for $7.50 a ton in a December auction in the Northeastern trading system known as the Regional Greenhouse Gas Initiative. That system covers emissions from power plants in nine states that include Connecticut, New York and Massachusetts.
These actions deserve applause. But their real value may lie in providing a template for the rest of the world.
The New York Times editorial board is, with one exception, citing actions that have not taken place yet as evidence contrary arguments "are simply unfounded." Is there a topic outside of global warming/greenhouse gas emissions that inspires such intellectual laziness? [1]

Two Cap and Trade initiatives cited in the editorial are the California centred Western Climate Initiative (WCI) and the U.S. northeast's Regional Greenhouse Gas Initiative (RGGI).

A couple of years ago the U.S. Energy Information Administration (EIA) wrote on the RGGI. From the graphic I guess one could conclude it had been super super great as emissions were far below cap - or one might think the cap was set far too high, particularly if one reflected on why cap space continued to be held by the emitters allocated the emissions allotment (and/or traders), and not sold to somebody wanting to emit.


I thought, examining this graphic, it looked like the new lower cap was still likely to be above "business as usual" emissions, particularly as similar banked credits have been a source of contention in the European Union's Emissions Trading System (EU ETS) - so, on twitter, I asked the EIA, and was politely told who to contact for more information - but I wasn't looking for more information, I was looking for a firm "no", and not receiving one, I was not inspired to pursue study of the RGGI scheme further.

Friday, January 22, 2016

Beyond expectedly high cost: 2015 Ontario Electricity Summary Part 3

During 2015 most Ontario consumers experienced a 12% rise in the commodity price of electricity. The figure is higher than the 8% average annual increase over the past 8 years, but follows the trend of rate increases that was predictable, and if predictions had been heeded properly, largely preventable. In this post I'll note the actions driving the cost of a kilowatt-hour for the common Ontario ratepayer 85% higher over the past 8 years.

In my first post summarizing 2015 figures, I graphed the annual increases in the global adjustment and accompanied declines in the costs recovered through market sales. From 2007 to 2015 the total cost of electricity supply in Ontario grew from around $8.8 billion to $13.7 billion. The move away from recovering costs through market sales is important, but to find the most basic cost drivers we should first find elements of the $4.9 billion supply cost increase, and then explain the rate escalators taking the 55% increase in supply costs to an 85% increase in the supply price for most Ontario ratepayers.

Unexpecting the expected.

If cost increases still surprise some, it must be that the topic is too complicated for most, because clear warnings have existed. Price forecasting took a huge jump in Ontario with Bruce Sharp's August 2010 report prepared for the Canadian Manufactures & Exporters (CME). Prior to the report the price speculation attached to an escalated push into renewables came from the push's instigator, George Smitherman"We anticipate about 1% per year of additional rate increase associated with the [Green Energy and Green Economy Act] bill’s implementation over the next 15 years." [2]  Sharp's August 2010 estimates put the cost much higher - at about $30/megawatt-hour (MWh) for the renewables supply with additional cost for distribution and transmission charges due to the Green Energy and Green Economy Act. The provincial Long-Term Energy plans following Sharp's report seemed to adopt his numbers, and consequently his forecast altered the reality slightly. Nonetheless, 2015's enormous $9.96 billion global adjustment total is only 2% off the total Sharp predicted in a second report 4 years ago.

Up we went

In my second post summarizing 2015 figures I demonstrated my estimates, inclusive of cost for distribution-connected (Dx) supply, largely agreed with the planned expenditures attached to 2013's long-term energy plan. It is important to note the system operator [IESO] current reporting on 2015 totals is only for "supply connected to the high-voltage transmission [Tx] system." The IESO's Tx reporting, as I've previously communicated, provides an increasingly inadequate image of Ontario's electricity generation - and it's encouraging this is being recognized by sector commentators as diverse as Parker Gallant and Tyler Hamilton.
The following graphic demonstrates my estimates of all 2015 generation (including Dx) and related supply costs (including Dx and curtailment):

Calculation exclude other costs included in global adjustment (such as conservation spending". See footnote 1 data.


The IESO's failure to develop reporting on generation from contracted supply within local distribution networks is now missing reporting on about 10% of Ontario's supply costs - mostly attributable to solar panels.

Saturday, January 16, 2016

ignorance shines on solar - and Toronto

Today's blog entry deals with serious data issues - from collection to reporting.

I have other blogs for other purposes: one aggregating articles from elsewhere; another for quick comments, or to work out one aspect of a bigger story, and an edgier blog intended to be meanly funnier in a way that could alienate some readers from my posts here. Today's post will draw on recent material from my other blogs as a petty squabble has reached an interesting data point.

The Toronto Star's Queen's Park columnist, Martin Regg Cohn (MRC), has been working to downplay the recent report from Ontario's Auditor General on the electricity cost impacts of  the province's failure to adhere to the professional Electricity Power System Planning it had designed and introduced.[1] MRC's latest column is titled "Why cheap hydro was too good to be true."

For perspective on the Star's "too good to be true" perspective, one might look at the trend over 50+ years in the country just south of us.


MRC's column today ends with "we can grapple with our electricity reality — a prerequisite to generating better outcomes." Presumably, if one were a grappler, one might look to Q & A for Ontario’s hydro system from the Star's "Queen's Park Bureau Chief Robert Benzie and Queen's Park Bureau reporter Rob Ferguson - but that would be a mistake. Here's their first point:
How is Ontario's Electricity Generated?
The majority of Ontario’s electricity — 60 per cent last year — comes from nuclear reactors at Bruce, Darlington, and Pickering. Almost a quarter — 24 per cent — is from hydro-electricity from places like Niagara Falls, while 10 per cent comes from natural gas-powered generating plants. Only 6 per cent is from wind, and less than 1 per cent comes from solar, with a similar amount of electricity generated by biofuels.
No, that's not so.

Monday, January 4, 2016

2015 Ontario Electricity Data Summary Part 2: component costs, and cost shifting


The electricity sector data widely communicated by the system's operator (the IESO) is increasingly inadequate for analysis of cost and demand trends in the province. This post needs to utilize more obscure data, and the creation of some data through estimates, in order to demonstrate the causes of overall higher prices and the shifting of costs to the smallest consumers of electricity. 2015 continues a trend of rising overall electricity costs, and the increases are amplified by 50% for small consumers.

Consumers can be broadly grouped into three groups: exporters, Class A and Class B. In 2015 a new website appeared that does provide a quarterly report indicating the much different pricing for Class A consumers ("large electricity consumers"), and all other domestic consumers - Class B.
Up to the end of the September the total pricing for the classes was quite different: Class A had averaged $6.24 cents per kilowatt-hour ($62.40/MWh), which was 37% lower than Class B's 9.89 cent/kWh average.

To understand the cost drivers it's useful to first examine the difference between the forms of generation the IESO considers "Ontario Demand", and the metered consumption of Ontario consumers.
The IESO provides, upon requests, figures for "consumption" by the consumer classes defined by the global adjustment mechanism/s. With these figures, and the breakdown of the global adjustment totals by class A and class B published by the IESO, it is possible to recreate the reported average commodity rates. The widely cited "Ontario Demand" refers to demand for supply from transmission connected (Tx) generators. Other generators are connected within distribution grids (Dx). Consumption figures for December won't be available until after the global adjustment totals are finalized in mid-January, but we have enough data to estimate 2015 and demonstrate that over the past 5 years "consumption" in Ontario has gone from being less than "Ontario Demand" to exceeding it.

The change in the the difference between Tx generation ("Ontario Demand") and consumption means that generation is increasing within distribution (Dx) networks. It should be expected that Dx generation data be reported along with Tx data to properly communicate component supply costs.

Sunday, January 3, 2016

2015 Ontario Electricity Data Summary Part 1: the basics

I'm hoping to produce 3 posts for the new year. This one will be more familiar for long time readers as I try to keep it constrained to data that is freely and widely available. A second post will use my estimates of additional data to provide a fuller illustration of that state of Ontario's electricity sector in 2015, and the other will hopefully be more disruptive, connecting data to provincial, national and international events and personalities.

Ontario's simplest electricity data is hourly data from Ontario's electricity system operator (IESO) for demand, imports, exports and Hourly Ontario Energy Price (HOEP). Using only this hourly data annual "Ontario Demand" is indicated as lower than it's been since the market opened in 2002 - and using other data available on the IESO site the demand is lower than it's been for over 2 decades.

Curiosity took me back to a graphic in my first blog post, in 2010, which confirmed it has been a full quarter of a century since Ontario's generators produced less than the 137 million megawatt-hours (MWh) the IESO shows as "Ontario Demand" in 2015.

Ontario Generation is calculated, in the graph above, from the base IESO data as "Ontario Demand" plus "exports" less imports. As that generation exceeded provincial demand by more than ever in 2015, it's not surprising the weighted average market price (HOEP) set a record low at $23.58/MWh.

Record low pricing was accompanied by record high exports. Valued at hourly rates (except when negative after the banning of negative priced exports) revenues from exports look to have been 56% lower than in 2008 - the previous record export volume.