Showing posts with label capacity value. Show all posts

Tuesday, June 6, 2023

on the risk of power shortages in Ontario this summer

A regulatory body with a mission “to assure the effective and efficient reduction of risks to the reliability and security of the grid,” delivered its “Summer Reliability Assessment” for North American jurisdictions last month. The brief news release for the document:
warns that two-thirds of North America is at risk of energy shortfalls this summer during periods of extreme demand. While there are no high-risk areas in this year’s assessment, the number of areas identified as being at elevated risk has increased. The assessment finds that, while resources are adequate for normal summer peak demand, if summer temperatures spike, seven areas — the U.S. West, SPP and MISO, ERCOT, SERC Central, New England and Ontario — may face supply shortages during higher demand levels.
Toronto Centre MPP, the NDP’s Peter Tabuns, used that document to launch an attack on the government’s management of the electricity system in the Ontario legislature on June 1st:
“…the body that oversees electricity grids in North America reported that Ontario risks power outages this summer. In fact, Ontario is the only province in Canada that is rated with elevated risk that it can’t meet peak demand. After five years, this government’s policies of cutting funding for efficiency and conservation, of demolishing wind farms and cancelling other renewable projects have led to this.”
This has gotten the rabble roused - if the media is any indication. The Toronto Star and CTV news both reported on topic. CTV’s reporting included comments from an expert, who advised, “There really is not any cause to be alarmed”, but also commentary from the opposite sort - politicians Tabuns and the leader of Ontario’s Green party.

Since this topic doesn’t seem to be going away I’ll explain some of the structure and content of reporting on reliability, and address the substance, or lack thereof, in the criticism of the government as reducing reliability through canceling plans for additional ‘green’ energy.

Thursday, January 30, 2020

Ontario electricity demands - an appendix.

Last week Ontario's Independent Electricity System Operator (IESO) released its first Annual Planning Outlook (APO), which is pertinent to the next article I wanted to write. This isn't that article - it's an explanation of graphics I created for the article I want to write.


While the APO the first of the new thing, it's just the latest in a line of forecasts intended to guide electricity planning in the province. This graphic shows 5 previous forecasts, but I felt I should explain their origins, and note they may not be strictly comparable. "Demand" is, in Ontario, a word that is, by itself, not very definitive.

Friday, March 1, 2019

Value lessons from Ontario electricity statistics

Data - and lots of it.

While I'll try to prevent this post from sliding into an abyss of Ontario electricity statistics, I'll be citing provincial data as the basis for discussion about public understanding being restricted by the presentation of data from official sources, and present new views of generally unreported data that would benefit literacy in valuations of electricity sources - an area where reckless ignorance blooms again and again.
but enough about academics, let's dive in!

The old standard of valuing generation sources is the Levelized Cost of Electricity (LCOE ). I was particularly pleased in late 2015 when a report from Ontario's Auditor General included a figure (5) indicating the cost and quantity of energy sources for 2014. I was more pleased a few years later when I received figures from a freedom of information (FOI) request with the same information for years 2007-2015. While I think the data is terrific, when I wrote about it I cautioned on presenting LCOE, "stressing these calculations deserve a big asterisk and lengthy footnote on the impacts of things such as curtailment and capacity payments." 

I have now done the data work required to add that lengthy footnote on curtailment and capacity payments.

I am certainly not unique in hoping for superior valuation tools to LCOE: the U.S. Energy Information Administration (EIA) has developed a  Levelized Avoided Cost of Electricity (LACE) metric, and the International Energy Agency (IEA) a Value-Adjusted Levelized Cost of Electricity (VALCOE - see pg 41). LACE is intended to value the cost (of alternatives) avoided by the generation, with the intent LACE > LCOE would signal a good project. VALCOE attempts to recognize the different capabilities of sources in providing firm capacity and flexibility. The specifics are less important than the principles: not all generation is of equal worth to systems that are intended to minimize loss-of-load situations. Concrete examples of LUEC's limitations will help conceptualize the issues that have people looking for better valuations.

Before I discuss my data I will note one other frequently cited source of Unit Cost in my province (I regard LUEC and LCOE as interchangeable terms): the Ontario regulator. Their most recent explanation of regulated rates includes a table (3) indicating hydro at 6.2 cents per kilowatt-hour, nuclear at 7.7, wind at 15.9, gas at 18.8 and solar at 51.3 c/kWh. I'll show replacing the OEB list's lower cost supply with gas is likely to lower total costs.

I have collected hourly data for the transmission-connected (Tx) generators reported by Ontario's system operator, including imports, and I've estimated (hourly) distribution-connected generation (Dx), curtailed supply, and contracted cost, either by unit generated (or curtailed), or by capacity required to be available. My base union query in working the data has over 16.4 million records. I will not repeat the word "estimate" in this post but simply note this one time it may be applied to everything (my work and the numbers from the IESO and OEB I cite).  

Here is my summary of annual generation and costs from 2008-2018:

Monday, April 16, 2018

Carbon-Con: ECO communication

A couple of weeks I was asked about potential ways to collaborate with reputable sites. I put some thought into that before responding that simply an association with me could bring a site to disrepute, but my thoughts on communication persist. From the belligerent uttering of a federal Minister on a Sunday talk show, to a media blitz from an organization marketing itself as expert on economic tools to reduce carbon emissions, to the Ontario report I'll feature in this commentary, it's been as if a convention of climate change alarm is occurring.

A Climate convention.

Comic Con (short for convention) is a really big event now, which makes some sense in this era of communication. Text is a low impact medium - the sites adding audio and video, integrating with podcasts, have a huge advantage. As the comic and related genres (science fiction, fantasy and superhero) grew from print to screens of all sizes, the graphics and sound growth has simply piled success onto success. The term "simply" recognized almost all characters can be grouped into good or bad.

Perhaps due only to my musing about communication, collaboration and branding, I thought the polarized nature of climate, and energy discussions, make Comic Con a model for communication and promotion in the 'clean tech' industry.

I'd prefer to be a hero, but realize the model needs villains too.

What I hope will be found in my little section of this Carbon Con is data-driven iconoclasm delivered through research, competent data handling, pointed if not visually appealing graphics, and full contact criticism of those blissfully unaware they deserve to be blisteringly opposed.

What many will find is villainy - I've been accused as anti-wind, anti-renewable, anti-conservation, pro-nuclear, disrespect and misogyny. I don't agree with that entire list, but I'm okay with being the villain if it makes for better heroes.

My concern with the profession of professing concern about carbon emissions begins, as most things do, with religion.

Friday, November 17, 2017

A benefit of Electricity trade - and what's reducing it

I was wrong.

I've been broadcasting a couple of messages about Ontario's electricity exports: that only the IESO can accurately report on the revenues, and that exports at negative prices are not allowed under market rules. It now seems neither of those is correct. Not only can export revenues be calculated, the analysis of export volumes, and revenues over time reveals benefits of markets, and trade. It's not at all clear Ontario's electricity powers understand the benefits.

I was recently alerted to a claim that the export revenues could be calculated from Intertie Schedule and Realtime Market Price reports. If that sounds confusing it'll gets worse before I'll try to ease off the jargon. As the Intertie Flows reporting is hourly, and the Realtime Market Price reports in 5 minute intervals some data manipulation is required to match the data sets. The IESO has posted annual files (.csv) with values from each of these reports for 2010 through 2016. To dispatch with the technical talk in one confusing swoop, I'll simply note that averaging the "ENGY" rate by delivery hour for each control area in the Realtime Market Price reports, and multiplying that by the "OFFT" value in Intertie Flows report for the same control area does result in the annual figures the IESO has released either to the Office of the Auditor General or in response to Freedom of Information Requests.
I can now extend my work from a previous post to include 2016 data.


Having worked the data down to the hourly time-frame by control area I can additionally summarize revenues, and costs, by jurisdiction. The results have some important messages about trade - as each "control area" has a separate market control price.

I won't discuss imports much in this post because there's nothing new to discuss. Most imports into Ontario are now from Quebec (over 82% since 2012 began), and those are valued in the new analysis almost exactly as the typical Hourly Ontario Energy Price (HOEP) valued them.

Messages about trade from this analysis may be hidden by the realities of communicating summaries of very large data sets. I posted some graphics on hydro(electric) generation by river system, and I received an e-mail from somebody who likely wanted to pursue a story, asking if the data was public knowledge. It was every bit as much public knowledge as what I am writing on today - summarized from hourly data captured from IESO hourly reporting since 2010. However, as most can't process the hourly information, and an official source had not published a summary, it wasn't the basis of a story. I think publication of a summary by an official source is what is required to be considered "public available".

The IESO once summarized volumes and revenues for exports and imports on a web page at www.ieso.ca/imoweb/siteshared/imports_exports.asp (long since a dead link). These monthly totals were meaningfully publicly available as they were both available and summarized by a trusted figure. Remnants of the IESO summaries remains in old government press releases, such as this from May 2012:
"Ontario's electricity market generated over $20 million in April by exporting electricity to other states and provinces, bringing total net export revenues to over $75 million this year.
That figure was, in hindsight, actually net exports ($28.6 million revenue from exporting less $8.1 million importing cost). In 2012 I noted:
[my] figures on export sales are estimates based only on the [Hourly Ontario Energy Price] ... in actuality export customers pay different rates. Because Ontario's market pricing is lower, sometimes much lower, than adjacent jurisdictions, it appears from both the ministry 'news' releases, and National Energy Board reporting, we generally export power about 10% above the HOEP  rates.
10% was the assumption I had when the IESO ceased summary reporting, but with the base data now summarized, I now know that assumption became wrong as they moved up and up, to nearly 70% above HOEP valuations by 2016.


Thursday, November 9, 2017

Alberta. Bound.

The government of Alberta has a plan to "reduce carbon emissions."
Their plan restricts the ability of the province to efficiently minimize greenhouse gas emissions.

The three aspects of the Alberta's "Climate Leadership Plan" most relevant to the electricity sector are:
  • implementing a new carbon price on greenhouse gas emissions
  • ending pollution from coal-generated electricity by 2030
  • developing more renewable energy
I've seen my province - Ontario - cited as an impediment to growing renewable energy in Alberta. This is understandable from a cost perspective, but if reducing emissions were the primary goal Ontario's example would be encouraging, as its emissions from generating electricity are a fraction of Alberta's.

I realize most Albertans are not awaiting opinions from Ontario, but I'll trust my analysis will be of interest to some in Alberta, and some elsewhere. Alberta is simply the sample case I'll use to argue specifically banning coal-fired electricity is unnecessary, and quotas for renewable sources to provide a fixed percentage of supply a little worse than that. This is not to argue for coal or little supply from renewables. Functionally, what I'll point to as better policy is likely to result in similar outcomes. I intend to demonstrate rules are being gamed to predetermine an unambitious outcome at the expense of achieving greater things.

A brief review of Albert's electricity system will be helpful prior to discussing the growth of renewables and elimination of coal. 

Figures are collected from AESO annual market statistic files (year 2013-2016) 

Available figures for Alberta's electricity generation include the percentage of electricity produced by generation technology. Unfortunately some categories change in 2010, but whether 2016 is compared to 2010 (the earliest year of the current categories) or 2004, coal has lost the greatest market share, and it has lost it to wind (probably the greatest change since 2004, natural gas (Combined Cycle gas turbines had the biggest 2010-2016 growth) and "Cogen" (for co-generation). Coal does continue to have 60% market share by this measure, so adding renewables until they have a 30% share seems doable - but it's more difficult depending on the definition of the market.

Thursday, October 12, 2017

Site C'ing: BC's electricity adventure

Site C is a hydroelectric project in British Columbia that may soon to be cancelled.

The commentary surrounding the Site C project has been driven by political posturing, and a recent change in government is therefore likely to end, at least temporarily suspend, the project. The situation is worth commenting on from afar because while it's B.C. today, in another time and other places some different - and many of the same - people will be discussing the merits of big, public, baseload power projects and small, private, sporadic power projects.
"BC Hydro’s Site C Clean Energy Project will be a third dam and hydroelectric generating station on the Peace River in northeast B.C. It will provide 1,100 megawatts (MW) of capacity, and produce about 5,100 gigawatt hours (GWh) of electricity each year..."   BC Hydro
I have 4 questions I wish to address in discussing the future of Site C:
  1. Will there be a need for capacity?
  2. Will there be a need for energy?
  3. What are the costs and benefits of a Power Purchase Agreements (PPAs) with Independent Power Producers (IPPs)?
  4. What are the costs and benefits of publicly owned generation assets
While Site C would have a reservoir (9,300 hectares), the main energy store for the system would remain the Williston Reservoir (177,300 hectares) upstream on the same system. It's not surprising the site would generate 5,100 GWh annually as the implied 53% capacity factor[1] is essentially what the B.C. hydroelectric fleet achieves annually. [2]

Many of those claiming Site C won't be necessary comically follow that argument up with a list of alternative generation technologies. To evaluate the alternatives it is first necessary to determine the value Site C may provide.

B.C. currently has adequate supply - it's peak "load" occurred early in 2017, and the province was a net exporter of power during that peak (as it is during most peaks). BC Hydro's resource planning anticipates the ability to meet the peaks to become less certain, and disappear around 2023. The need for additional annual energy is predicted to come later. The difference between the ability to meet peaks and the ability to provide enough energy throughout the year is important.
Graphics from BC Hydro. Links to view source graphics: Capacity and Energy

Friday, September 29, 2017

Ontario Electricity Operator brags of ICI subsidy, continues spending on wind experiment

7 days after news broke of a lawsuit claiming the global adjustment charge is “an unconstitutional tax, not a valid regulatory charge,” Ontario's electricity system operator (IESO) issued a news release congratulating their generators and certain consumers:
Ontario’s peak demand days typically don’t happen at this time of the year. Yet with hot weather persisting, and in spite of summer’s end last week, the province experienced new annual peaks this week of 21,786 MW on Monday and 21,542 MW on Tuesday.
Generators did their part to help meet the peaks, as well as Ontario’s consumers participating in the Industrial Conservation Initiative (ICI) and other demand response initiatives.
According to preliminary analysis, consumers participating in the ICI are estimated to have reduced peak demand by over 1,500 MW this week. By reducing demand during peak periods, ICI participants can both reduce their electricity costs while helping to defer the need for investments in new electricity infrastructure that may otherwise be needed.
They didn't mention if the 21,783 MW remains 2017's annual peak it will be a record annual low (the 3rd one recorded in the past 4 years).


Friday, December 30, 2016

Nuclear Ontario - and giving electricity away

first posted on cold air currents.

Since I posted Reliable Electricity Generation Capacity declining in Ontario the IESO's NPCC 2016 Ontario Interim Review Of Resource Adequacy was published.
It's exciting stuff:
The Independent Electricity System Operator (IESO) submits this assessment of resource adequacy for the Ontario Area in accordance with the NPCC Regional Reliability Reference Directory #1, “Design and Operation of the Bulk Power System.” 
Spoiler alert!
The report concludes Ontario's system can meet Loss of Load Expectation (LOLE) criteria for the 2017 to 2020 planning period once Emergency Operating Procedures (EOP) are assumed. EOPs are indicated to be essentially 1/3rd public appeals to reduce consumption, and 2/3rds voltage reductions.

Phewff.

I wrote "With the exception of 2013 the capability at peak has declined every year since 2010, despite IESO-connected generator capacity being greater now than it was six and a half years ago," so I thought it only fair I offer a brief analysis of how the IESO is meeting the reporting requirements for resource adequacy - and the repercussions of how they are doing so.

Sunday, December 18, 2016

Reliable Electricity Generation Capacity declining in Ontario

Ontario's electricity sector provided some material worthy of commentary over the past week.

A new 18-month Outlook issued by the IESO (the province's system operator) begins cheerfully enough:
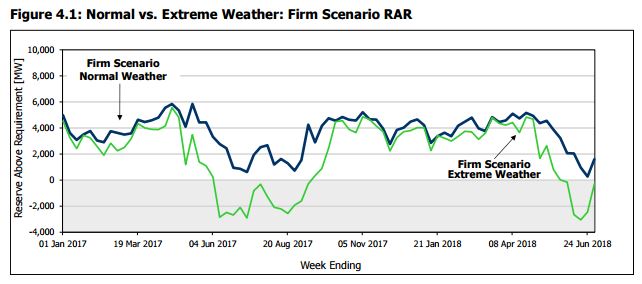
The outlook for the reliability of Ontario’s electricity system remains positive for the next 18 months, with adequate generation and transmission to supply Ontario’s demand under normal weather conditions.
This is reassuring - unless there's a particularly hot run of weather:
Under extreme weather conditions, the reserve is below the requirement for 19 weeks over the entire Outlook period, with the largest shortfall being approximately 3,000 MW.
19 weeks in 18 months is 24% of the time - corresponding with the quarter of the year known as summer. In a province introducing carbon pricing in January (poorly), apparently the government is unconcerned about local warming.

firmscenario

There has been similar language in previous 18-month outlooks:
During the Outlook period, the...forecasts show that Ontario’s available generation exceeds projected demands...there are periods when Ontario’s available reserves are forecast to be ...below the IMO’s required planning reserve levels.
That from the Outlook produced in April 2002.

I'm sure today's Wynne government finds comfort in how well Ontario's system coped with heat waves in 2002 and 2003 - despite their braying indicating the opposite.

Wednesday, November 30, 2016

Ontario Energy Minister Previews Long-Term Energy Plan Themes

"I've really come to respect the enormous complexity of the energy and electricity system in Ontario."

Ontario's rookie Minister of Energy, Glenn Thibeault, is now confident enough of his grasp of the province's energy system that he unveiled themes for an upcoming Long-Term Energy Plan in a speech to the Empire Club:
  1. Nature and style of procurement should be technology agnostic
  2. Ontario's electricity market renewal/reform to provide better value
  3. Empowerment of consumers
These are ambitious themes. Unfortunately Minister Thibeault didn't display an understanding of the institutional barriers to change, and he's going to need to confront the demons of the sector before meaningfully advancing any of these goals.

He seems to expect the barriers to deliver change.

Sunday, July 10, 2016

New wind study provides a good argument for nuclear power

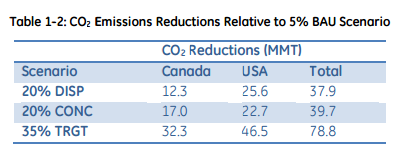
Last Wednesday I posted my critique of a wind-water-sun (WWS) fantasy for Canada, which unknowingly coincided with the Canadian Wind Energy Association (CanWEA) release of a Pan-Canadian Wind Integration Study (PCWIS) 1. The PCWIS, primarily prepared by a branch of industrial wind turbine manufacturer General Electric, contains statistical work that should be of interest to those looking at capacity valuation, and its impact on electricity supply mixes. However, the basic data discipline indicated by the study is poor. Unfortunately a rather deep read of PCWIS is necessary to realize how unimpressive the expected impacts of adding industrial wind to Canada's generation mix are.

The main conclusion of the study is that building out the wind industry in Canada does very little to reduce greenhouse gas emissions in Canada.


The study was mostly paid for by Canadian taxpayers via Natural Resources Canada:
 "The project’s primary goal was to obtain insight into the challenges, opportunities, mitigation measures and operational tools needed to efficiently integrate wind energy into the grid. This has been accomplished by undertaking an integration study approach, which involves matching time series modelled wind energy production data with electricity demand data, and evaluating how this influences the rest of the electricity grid."
I'll evaluate the data work for Ontario, although some claims the study makes for other provinces also demand comment.

Wednesday, July 6, 2016

Wind Water and Sunlight: Jacobson's sorcery

Dreams of a future powered by wind, water and sunlight (WWS) have been spread by Stanford professor Mark Jacobson. Jacobson's work is more optimistic about the contributions to come from WWS than other projections, which may explain an infectious political appeal. In my country the allure of a WWS power supply is impacting Canada's most left political party, the NDP.

SK Premier Wall and Lead Leaper Klein exchange tweets
I've looked at the the WWS work and will demonstrate its shortcomings in Ontario, with the expectation that can be extended to all northern jurisdications. One inspiration for looking at the viability of WWS is opportunistic: Ontario, with a new Minister of Energy, is initiating another Long-Term Energy Plan (LTEP) process. The WWS work provides a test case to run through a data model I created for the previous LTEP planning, and refine my work as necessary.

I won't concentrate on Jacobson's work to nearly the extent of Jani-Petri Martikainen's convincing and entertaining Why does Mark Jacobson hate Finland? or multiple insightful articles at the "A Chemist in Langley" site, including the most recent, Debunking the Leap Manifesto’s 100% Wind, Water and Sunlight Annual Energy, Health, and Climate Cost Savings. I'll attempt to limit myself to briefly discussing how the WWS paper arrived at its supply mix for Canada, and testing that mix within an hourly model - the only way a mix can be rigorously tested.

The April 2016 draft paper from Jacobson and others, 100% Clean and Renewable Wind, Water, and Sunlight (WWS) AllSector Energy Roadmaps for 139 Countries of the World, concluded, "The study finds that the conversion to WWS is technically and economically feasible. The main barriers are still social and political." It's a grand claim for a draft exercise that claims only to,
"[calculate] the number of generators of each type needed to power each country based on the 2050 power demand in the country after all sectors have been electrified but before considering grid reliability and neglecting energy imports and exports."
WWS does not present itself as attempting any hourly modelling of an electricity system, building requirements solely based on total energy requirements for a calendar year.

Thursday, June 23, 2016

The declining capacity value of solar in Ontario, and beyond

A solar panel added to Ontario, today, has a capacity value of less than 6% and the reality is if solar continues to be added peak requirement for new supply will move to winter evenings and instead of new solar’s capacity value being close to nothing it will be absolutely zero.
I wrote that yesterday and, inspired by an exchange on Facebook, want to support the statement, add industrial wind to it, and argue the relevance of the statement not only to Ontario, but in California where the claim is a nuclear power plant can be closed and the output replaced with negawatts/efficiency/conservation, solar and wind.

Electricity supply is of value to a system in multiple ways. The two I examine are basically the actual watt-hours of output (I'll call this "energy value", and the ability to produce the output when demand calls for it (this I will call the "capacity value"). 

The diminishing value energy value of intermittent generation should not be well known. I was excited to write on the decrease three years ago, but a current work from Lion Hirth (and Simon Müller) explains well why now seems obvious:
In hours of high wind speeds, the additional supply of electricity from wind turbines depresses the price below the level it would otherwise have been. This price drop is greater, of course, when larger amounts of wind power are installed, a phenomenon that has been described as the “self cannibalization effect” (a dramatic term for the simple consequence of increased supply). As a consequence, the market value of wind power declines with its market share.
This post will deal only with "capacity value".

Additional solar, and wind supply, have lower capacity value today because the operator of Ontario's electricity system, the IESO, released an updated outlook showing the capacity of solar panels connected to the IESO's system grew by 240 megawatts (MW) over the past 12 months, but the IESO expected only 14 MW of production from that capacity during the peak demand for generation. Dividing 14 by 240 gives a measurement for the capacity value, of 6%.

Less notably, but likewise moving lower, industrial wind turbine capacity increased 898 MW, with only 105 MW more output expected at peak demand. That's a capacity value of 10.4%, and as with solar, it's worth stressing those are the IESO's numbers, not mine. I'll address whether those figures are valid in a future post.

The reason for the decline is the expected hour of peak demand has moved later in a summer's day. The reason for the move is not a changing consumption patterns, but changes in the electricity supply mix. While this doesn't change the valuation story, it does require some explanation.