
A new 18-month Outlook issued by the IESO (the province's system operator) begins cheerfully enough:
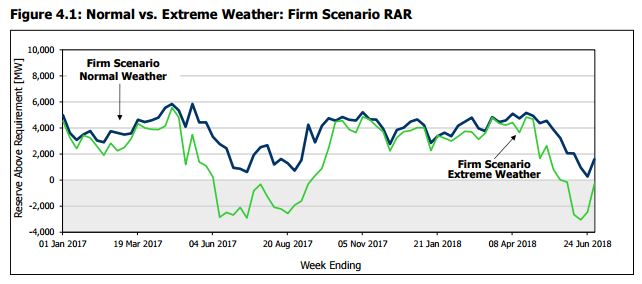
The outlook for the reliability of Ontario’s electricity system remains positive for the next 18 months, with adequate generation and transmission to supply Ontario’s demand under normal weather conditions.This is reassuring - unless there's a particularly hot run of weather:
Under extreme weather conditions, the reserve is below the requirement for 19 weeks over the entire Outlook period, with the largest shortfall being approximately 3,000 MW.19 weeks in 18 months is 24% of the time - corresponding with the quarter of the year known as summer. In a province introducing carbon pricing in January (poorly), apparently the government is unconcerned about local warming.
There has been similar language in previous 18-month outlooks:
During the Outlook period, the...forecasts show that Ontario’s available generation exceeds projected demands...there are periods when Ontario’s available reserves are forecast to be ...below the IMO’s required planning reserve levels.That from the Outlook produced in April 2002.
I'm sure today's Wynne government finds comfort in how well Ontario's system coped with heat waves in 2002 and 2003 - despite their braying indicating the opposite.
The IESO measures it's capacity requirements by ascertaining the anticipated "Capability at Outlook Peak" for resources. This is a complex topic for a number of reasons, the most curious may be the movement of the peak demand for IESO supplied power to later in the day due to the growth of solar generation embedded in distribution (non-IESO) networks. From a simply IESO grid perspective, the following simple tracking of overall capacity, and the capability to meet peak demand, is valid: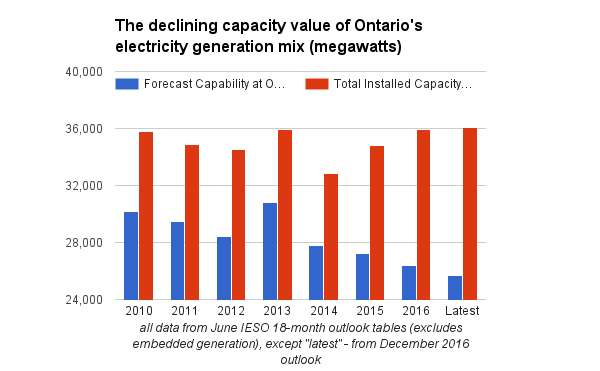
With the exception of 2013 the capability at peak has declined every year since 2010, despite IESO-connected generator capacity being greater now than it was six and a half years ago. Since all coal-fired generation was ended in 2013, capacity has been rising while the capability to reliably produce at peak demand has been declining.
Graphing only the IESO-connected generator capacity is deceptive, because a lot of recent generator growth is embedded. To provide a truer picture of changes in generating capacity I've included embedded generation, using June values from the Table 3.3.6 tab of the latest IESO 18-Month Outlook data tables. The recent December outlook showed "Capability at Outlook Peak", which is a recent switch for December outlooks that used to show the capability at the wind peak (significantly different). To be consistent in showing changes in capability during summer peak demand, I've used data from historical June 18-month outlooks, in addition to the "Latest" outlook.
The growth in total IESO-connected generation capacity since June 2010 (illustrated in the first chart) is only 289 megawatts (MW), while embedded generation has grown nine times that amount over the same period.
To establish the capability at IESO-grid demand peak including embedded capacity, I calculated the annual capacity credit (or value) by dividing the IESO's "Forecast Capability at Outlook Peak" by its "Total Installed Capacity".[1]

The result of multiplying total capacity (including embedded) by capacity credits is the annual capability at peak:
This graphic has expected element and surprises.
Expected are low contributions expected at peak demand from wind and solar. The capacity value of solar dropped only because earlier embedded solar moved the peak demand from the IESO-grid to early evening. This demonstrates a weakness in treating capacity value as fixed: the first solar panels had higher capacity values because the peak need for incremental supply was in the mid-afternoon, but new panels have low values as the need is pushed later in the day. Wind is also weaker (on average) later in the afternoon during the summer.
Surprising, to me, is the extent of the decline in capacity credit for nuclear and gas generators, and the lack of growth in hydroelectric's capacity value. Ontario Power Generation (OPG) spent $1.5 billion on its Niagara Tunnel project and $2.5 billion on the Lower Mattagami river, yet only 100 MW of additional capacity credit shows (since June 2010). Nuclear's declining capacity credit has to do with Darlington unit 2 being out of operation during refurbishment, and scheduled outages at other units for less comprehensive life-extension work.
The 850 megawatt decline in natural gas (and oil) generators' capacity value, since 2013, is surprising - but perhaps it should not be. Three generators appear to have ceased operations when their contracts expired, and the outlook shows 3 more ending by 2018. One of the shuttered generators was noted in the notes from the IESO's October Stakeholder Advisory Committee Meeting:
The IESO measures it's capacity requirements by ascertaining the anticipated "Capability at Outlook Peak" for resources. This is a complex topic for a number of reasons, the most curious may be the movement of the peak demand for IESO supplied power to later in the day due to the growth of solar generation embedded in distribution (non-IESO) networks. From a simply IESO grid perspective, the following simple tracking of overall capacity, and the capability to meet peak demand, is valid:
With the exception of 2013 the capability at peak has declined every year since 2010, despite IESO-connected generator capacity being greater now than it was six and a half years ago. Since all coal-fired generation was ended in 2013, capacity has been rising while the capability to reliably produce at peak demand has been declining.
Graphing only the IESO-connected generator capacity is deceptive, because a lot of recent generator growth is embedded. To provide a truer picture of changes in generating capacity I've included embedded generation, using June values from the Table 3.3.6 tab of the latest IESO 18-Month Outlook data tables. The recent December outlook showed "Capability at Outlook Peak", which is a recent switch for December outlooks that used to show the capability at the wind peak (significantly different). To be consistent in showing changes in capability during summer peak demand, I've used data from historical June 18-month outlooks, in addition to the "Latest" outlook.
The growth in total IESO-connected generation capacity since June 2010 (illustrated in the first chart) is only 289 megawatts (MW), while embedded generation has grown nine times that amount over the same period.
To establish the capability at IESO-grid demand peak including embedded capacity, I calculated the annual capacity credit (or value) by dividing the IESO's "Forecast Capability at Outlook Peak" by its "Total Installed Capacity".[1]
The result of multiplying total capacity (including embedded) by capacity credits is the annual capability at peak:
This graphic has expected element and surprises.
Expected are low contributions expected at peak demand from wind and solar. The capacity value of solar dropped only because earlier embedded solar moved the peak demand from the IESO-grid to early evening. This demonstrates a weakness in treating capacity value as fixed: the first solar panels had higher capacity values because the peak need for incremental supply was in the mid-afternoon, but new panels have low values as the need is pushed later in the day. Wind is also weaker (on average) later in the afternoon during the summer.
Surprising, to me, is the extent of the decline in capacity credit for nuclear and gas generators, and the lack of growth in hydroelectric's capacity value. Ontario Power Generation (OPG) spent $1.5 billion on its Niagara Tunnel project and $2.5 billion on the Lower Mattagami river, yet only 100 MW of additional capacity credit shows (since June 2010). Nuclear's declining capacity credit has to do with Darlington unit 2 being out of operation during refurbishment, and scheduled outages at other units for less comprehensive life-extension work.
The 850 megawatt decline in natural gas (and oil) generators' capacity value, since 2013, is surprising - but perhaps it should not be. Three generators appear to have ceased operations when their contracts expired, and the outlook shows 3 more ending by 2018. One of the shuttered generators was noted in the notes from the IESO's October Stakeholder Advisory Committee Meeting:
Mr. Burkom commented that while conservation has been discussed in terms of being delivered by programs, existing resources and those coming up for contract will have to live or die in the marketplace. This represents a significant flaw in the report and in the language with which LTEP is discussed with the government. Increasingly, demand can compete with generation, but the competition must be on sound footing. An example is seen in recent demand response auctions where the IESO procured capacity at around $11 per kilowatt-month while being told that the Lake Superior Power generating facility in Sault Ste. Marie was worth zero. It was shut down and there were layoffs. If there will be massive volumes of programs for demand response through 2030, then clearly generation will not be able to compete in the market.
It appears Ontario's government has treated firm, high capacity value, generators, poorly. It continues to do so, as the latest meddling letter from the Minister to the IESO, issued December 16th, emphasizes none of the non-utility generators are to be contracted beyond their current term while discussing Liberally spending on "conservation".
This week the government announced the signing of a agreement with Quebec:
When I started blogging I wrote on electricity largely because of the availability of data from the IESO - and my familiarity working data. The basis of my initial analysis was 3 simple text files the IESO updated daily - on demand, price/HOEP, and imports/exports. This week the IESO failed to produce those daily files, "Due to technical difficulties." Data is about discipline, with the production of timely reporting a key indicator of data competency... or ineptitude.
Under this agreement, the IESO will purchase a total of 14 terawatt hours (TWh) of electricity from Hydro-Québec over a seven-year period from 2017 to 2023.I wrote on this the previous time it was in the news, in October, there would be an agreement. I was curious enough to put a poll up on Twitter this week to text the level of understanding regarding Ontario-Quebec electricity trade (which has been a hot topic for over 3 years due to the propagandizing of groups opposing nuclear power). Few respondents recognized 14 TWh is half of what was imported into Ontario over the past 7 years - and 2 TW/year less than a third of what has been imported into Ontario from Quebec in 2016. The Toronto Star's headline the first time this agreement was announced was "Ontario signs deal for electricity from Quebec in bid to defuse anger over hydro bills." No doubt that was the intent, but with no historical figures on historical costs (or the cost of this agreement) the claim the agreement will "reduce the cost to its consumers by $70 million" is not particularly credible.
When I started blogging I wrote on electricity largely because of the availability of data from the IESO - and my familiarity working data. The basis of my initial analysis was 3 simple text files the IESO updated daily - on demand, price/HOEP, and imports/exports. This week the IESO failed to produce those daily files, "Due to technical difficulties." Data is about discipline, with the production of timely reporting a key indicator of data competency... or ineptitude.
This past week the Ontario Energy Report was produced for the 3rd quarter of 2016. It lacks the attention to detail that is the hallmark of quality data organizations:

The Gas output is reported incorrectly, probably by a decimal point (4.79 TWh is plausible). Not reported with the "grid-connected generation output" on the main page is the quantity of imported power from Quebec, although on page 3 it is indicated to have been 2.549 TWh. That is 8% of the transmission-connected market, and 62% more electricity than was provided by the legions of industrial wind turbines in the market. It's also 27% more than the new contract is to average annually.
Trade was working well before the governments, and the IESO, acted to fix it.
The 3rd Quarter reporting showed year-to-date Class B Commodity Cost of 11.13 cents per kilowatt-hour ($111.3/MWh).
The final global adjustment figures for November were posted last week, inclusive of a $111.09/MWh Class B rate. Combined with a $16.11/MWh weighted average Hourly Ontario Energy Price (HOEP), November's $127.20/MWh Class B Commodity Cost is a record - breaking the old $124.63/MWh set the previous month.
The final global adjustment figures for November were posted last week, inclusive of a $111.09/MWh Class B rate. Combined with a $16.11/MWh weighted average Hourly Ontario Energy Price (HOEP), November's $127.20/MWh Class B Commodity Cost is a record - breaking the old $124.63/MWh set the previous month.

In 2016's Ontario record rates aren't news.
Endnote:
1. Solar only appeared in the relevant IESO 18-Month Outlook capability at peak reporting in June 2015 (as that was the first period Solar was on the transmission grid). I use the calculated capacity credit from that report for all prior years (when embedded solar did already exist).The data work on IESO 18-month outlook figures is in this spreadsheet
4DD8EDEEF0
ReplyDeletesteroid sipariş
Skype Show Sitesi
steroid sipariş