Showing posts with label Independent Electricity System Operator (IESO). Show all posts

Friday, January 8, 2021

Ontario lost a record $1.8 billion dumping excess electricity in 2020

$1.8 billion dollars: that’s how much Ontarians lost selling electricity to neighbours in 2020 once the revenues earned from the sale are subtracted from the cost of producing the power.

By one accounting, which I’ll show is an Auditor General’s.

It’s been a while since my last post, during which period this blog turned 10. A decade ago, this month, a Premier noted some people think discussing losses on exports is fun, and at the same time lectured, “what you want to do of course is try to manage your system as best as you can so that there's as little extra electricity as possible.” Looking at the longer trend with the benefit of hindsight will be fun (of course), and as an added benefit it will provide a measure of the quality of the system’s managers.

Last month I was contacted by a friend looking to update claims from the 2015 Annual Report of the Office of the Auditor General of Ontario (the Auditor), including:
From 2009 to 2014...Ontario exported 95.1 million MWh of power to other jurisdictions, but the amount it was paid was $3.1 billion less than what it cost to produce that power

From a statistics viewpoint the biggest part of this challenge is figuring out what that $3.1 billion claim was based on. It turns out it’s demonstrated by Figure 10 in that 2015 report - and now we descend into the sordid world of Ontario’s electricity data to determine the origins of the numbers visualized in that graphic. 

I’ve added a tabular table which shows the figures I transcribed from the Auditor’s Figure 10 - not a precise process but one that provides valuable estimates for what is visualized. The difference between the cost of production and revenues in the graphic equal $3.1 billion. Before discussing the “cost of producing Exported Power...as estimated by [Office of the Auditor General of Ontario]” I will note both figure 5 and figure 10 in the 2015 Auditor’s report cite the IESO (Ontario’s hybrid electricity system operator) as the source of revenue from exports: figure 5 prints the figure for 2014 as $636 million while my transposition of the graphics - -done as it’s clearly not that - puts the figure a little below $750 million.

Same source, same measure, same year: two numbers. I’ll revisit this after I discuss a methodology behind the cost of producing exported power that reproduces the results graphed in the Auditor’s Report.

Sunday, February 9, 2020

An outlook against lower electricity costs

Can anything be done to reduce the costs of electricity in Ontario?

I get the question more frequently lately.The answer is “yes". Something, theoretically, could be done. 

In reviewing 2019’s electricity figures I estimated the average cost of procuring one megawatt-hour (MWh) of supply was $94, and showed how that became $126/MWh for most Ontario consumers. That is an indication there’s plenty of room to find savings, so much room that there’s a more important question than how to reduce costs.

It's also possible to prevent costs from falling. Having written on excess supply, cost shifting away from unimportant consumers to influential "stakeholders", high contract costs, and may other issues for nearly a decade, I'm not inspired to address the question of what could be done - the more interesting question I will address is, "What is being done to prevent costs from falling? 

The current government was elected on a platform that included the claim they’d, “Cut hydro rates by 12% for families, farmers, and small businesses.” Over their first year and a half in office there’s been little to inspire confidence they’re capable of delivering on that promise. A recently released provincial finance report noted the cost of electricity programs ballooning another $1.5 billion as they head towards $5.6 billion for 2019-20 (ending March 31). The hit on the provincial treasury is largely due to subsidies preventing consumers on regulated price plans (RPP) from seeing rates increase on their electricity bills.

The 12% cut in the Progressive Conservative’s platform was in addition to the [un]Fair Hydro Plan (FHP) of the previous Liberal government - which promised (and did) reduce bills 25% in the present by deferring costs to the future. I developed a great contempt for that plan, but I could also view it as an unpleasant distraction. The Liberal government did deliver a long term energy plan (LTEP) that promised cost controls through improving what is whimsically referred to as Ontario’s electricity market.
Market Renewal will ensure the province has appropriate sources of electricity at the lowest possible price. This initiative could save Ontarians up to $5.2 billion over a 10-year period. -Glenn Thibeault, Minister’s message introducing 2017 Long-Term Energy Plan, October 2017
The plan - the long-term energy plan - was to improve the market for consumers.

Then, the nominally Independent Electricity System Operator (IESO) consulted stakeholders/insiders. In 2 short years they’ve reduced potential savings to consumers - which might be considered costs to the IESO’s stakeholders/insiders- by over 80%.
The Market Renewal Program is an important piece of the equation for us. With the approval of the high-level designs of the energy work stream, and a business case that estimates we can achieve $800 million in net benefits over the first 10 years alone, we’ve built a very strong foundation for change. - Peter Gregg, IESO President and CEO, November 2019
A $4.4 billion drop in the promised decadal value of market renewal, in under 2 years, is only one way the IESO is maneuvering to prevent a reduction in spending on electricity supply in Ontario. Others include inflating demand forecasts, lowering performance expectations from existing generators, raising capacity reserve desires, and exaggerating the threat of rising emissions.

Thursday, January 30, 2020

Ontario electricity demands - an appendix.

Last week Ontario's Independent Electricity System Operator (IESO) released its first Annual Planning Outlook (APO), which is pertinent to the next article I wanted to write. This isn't that article - it's an explanation of graphics I created for the article I want to write.


While the APO the first of the new thing, it's just the latest in a line of forecasts intended to guide electricity planning in the province. This graphic shows 5 previous forecasts, but I felt I should explain their origins, and note they may not be strictly comparable. "Demand" is, in Ontario, a word that is, by itself, not very definitive.

Sunday, June 16, 2019

Market re-animation: the Herculean task of reforming Ontario’s electricity sector

My writing output seems to be inversely related to the number of calls for comments about different aspects of Ontario’s electricity sector. That’s probably not entirely accidental as I"m not motivated to work on demand for free, and the work seems much more complex than it did - hopefully as I see more connections between issues. Regardless, some thoughts have been percolating for many months and it’s time I release them into the wild. In this post I want to connect the Ontario government’s consultation on industrial electricity prices and the system operator's market renewal initiative, but if I only provide a backgrounder on the current market debacle, and how it came about, I think the reader will be rewarded for their attention.

I did write a post a year ago with 6 suggestions for the then-new Premier’s government. Reviewing the list now I see some action on 4 of the points. One exception remains “Restrict eligibility to the Industrial Conservation Initiative (ICI).” In terms of what can be done within today’s system my comments from last year remain my short-term position on industrial electricity prices:

Purging the ICI rolls of all entities with no actual exposure to trade will offer an immediate reduction in residential, and small business, electricity costs.

This would have an immediate benefit for smaller industrial consumers that are not eligible to participate in the ICI. The reality for existing industrial consumers within the ICI is that they have been largely protected from rate increases with a program promoting inefficient spending that only benefits ICI participants by adding to the burden of remaining Ontario consumers. Lowering rates further should be an outcome from lowering the electricity sector’s costs - not transferring costs to lesser consumer classes, most of which subsequently transferred costs onto future ratepayers and taxpayers.

The Market Renewal Initiative was the last government’s hope for future cost reductions, and there’s no indication today’s Ford government has changed tack. There’s a lot of fine analysis being done on different aspects of a new market design, and very informative reporting being produced. It’s just not clear, to put it very kindly, that there is a real commitment to a market system.

In the beginning (of the current structure) there was the Independent Electricity Market Operator (IMO), and its market, and maybe it was good for an hour or two but things went sideways pretty quickly.

Friday, November 17, 2017

A benefit of Electricity trade - and what's reducing it

I was wrong.

I've been broadcasting a couple of messages about Ontario's electricity exports: that only the IESO can accurately report on the revenues, and that exports at negative prices are not allowed under market rules. It now seems neither of those is correct. Not only can export revenues be calculated, the analysis of export volumes, and revenues over time reveals benefits of markets, and trade. It's not at all clear Ontario's electricity powers understand the benefits.

I was recently alerted to a claim that the export revenues could be calculated from Intertie Schedule and Realtime Market Price reports. If that sounds confusing it'll gets worse before I'll try to ease off the jargon. As the Intertie Flows reporting is hourly, and the Realtime Market Price reports in 5 minute intervals some data manipulation is required to match the data sets. The IESO has posted annual files (.csv) with values from each of these reports for 2010 through 2016. To dispatch with the technical talk in one confusing swoop, I'll simply note that averaging the "ENGY" rate by delivery hour for each control area in the Realtime Market Price reports, and multiplying that by the "OFFT" value in Intertie Flows report for the same control area does result in the annual figures the IESO has released either to the Office of the Auditor General or in response to Freedom of Information Requests.
I can now extend my work from a previous post to include 2016 data.


Having worked the data down to the hourly time-frame by control area I can additionally summarize revenues, and costs, by jurisdiction. The results have some important messages about trade - as each "control area" has a separate market control price.

I won't discuss imports much in this post because there's nothing new to discuss. Most imports into Ontario are now from Quebec (over 82% since 2012 began), and those are valued in the new analysis almost exactly as the typical Hourly Ontario Energy Price (HOEP) valued them.

Messages about trade from this analysis may be hidden by the realities of communicating summaries of very large data sets. I posted some graphics on hydro(electric) generation by river system, and I received an e-mail from somebody who likely wanted to pursue a story, asking if the data was public knowledge. It was every bit as much public knowledge as what I am writing on today - summarized from hourly data captured from IESO hourly reporting since 2010. However, as most can't process the hourly information, and an official source had not published a summary, it wasn't the basis of a story. I think publication of a summary by an official source is what is required to be considered "public available".

The IESO once summarized volumes and revenues for exports and imports on a web page at www.ieso.ca/imoweb/siteshared/imports_exports.asp (long since a dead link). These monthly totals were meaningfully publicly available as they were both available and summarized by a trusted figure. Remnants of the IESO summaries remains in old government press releases, such as this from May 2012:
"Ontario's electricity market generated over $20 million in April by exporting electricity to other states and provinces, bringing total net export revenues to over $75 million this year.
That figure was, in hindsight, actually net exports ($28.6 million revenue from exporting less $8.1 million importing cost). In 2012 I noted:
[my] figures on export sales are estimates based only on the [Hourly Ontario Energy Price] ... in actuality export customers pay different rates. Because Ontario's market pricing is lower, sometimes much lower, than adjacent jurisdictions, it appears from both the ministry 'news' releases, and National Energy Board reporting, we generally export power about 10% above the HOEP  rates.
10% was the assumption I had when the IESO ceased summary reporting, but with the base data now summarized, I now know that assumption became wrong as they moved up and up, to nearly 70% above HOEP valuations by 2016.


Sunday, October 15, 2017

A gathering in Prince Edward County

Today in Picton people will assemble at a rally against what has become a 9 turbine industrial wind development in a ecologically sensitive area near Lake Ontario. I won't be attending as it's a 3-4 hour drive away, but I will contribute by arguing the existence of the contract for the location, at this time, is indicative of negligence at Ontario electricity system operator (IESO).

Details at the Prince Edward County Field Naturalists Facebook page
This rally coincides with a legal action launched by the Association to Protect Prince Edward County (APPEC). 
APPEC has commenced legal proceedings naming the Independent Electricity Operator (IESO) and WPD White Pines Wind Inc. (WPD) as respondents. APPEC alleges that the Feed-In-Tariff (FIT) contract between the IESO and WPD should have been terminated as soon as it became evident that WPD would be unable or incapable of fulfilling the FIT contract terms. These FIT contract terms have been made publicly available and are well known.
In 2010, a FIT contract for 60MW wind energy project to be operational within three (3) years was offered by the Ontario Power Authority (now the IESO) to WPD. The contract allowed for termination if the project was not able to deliver at least 75% of the contracted power.  -APPEC (on Facebook)
The inability to deliver 75% of contracted capacity is but one of the reasons WPD cannot now fulfill their end of the feed-in tariff contract.

Friday, September 29, 2017

Ontario Electricity Operator brags of ICI subsidy, continues spending on wind experiment

7 days after news broke of a lawsuit claiming the global adjustment charge is “an unconstitutional tax, not a valid regulatory charge,” Ontario's electricity system operator (IESO) issued a news release congratulating their generators and certain consumers:
Ontario’s peak demand days typically don’t happen at this time of the year. Yet with hot weather persisting, and in spite of summer’s end last week, the province experienced new annual peaks this week of 21,786 MW on Monday and 21,542 MW on Tuesday.
Generators did their part to help meet the peaks, as well as Ontario’s consumers participating in the Industrial Conservation Initiative (ICI) and other demand response initiatives.
According to preliminary analysis, consumers participating in the ICI are estimated to have reduced peak demand by over 1,500 MW this week. By reducing demand during peak periods, ICI participants can both reduce their electricity costs while helping to defer the need for investments in new electricity infrastructure that may otherwise be needed.
They didn't mention if the 21,783 MW remains 2017's annual peak it will be a record annual low (the 3rd one recorded in the past 4 years).


Saturday, August 26, 2017

regarding Ontario Electricity Generation and Costs, 2007 - 2015

This week I was handed some data indicating, by supply type, electricity generation and costs in Ontario. The data was a hard copy response of the IESO to a freedom of information request. There's nothing in the data that will surprise readers of my work, but perhaps it's time for a refresher, as today I read one flip comment by a mainstream journalist, joking they'd like to see "Ontario families can no longer afford skyrocketing nuke costs," and an opinion piece on the public broadcaster's site which included:
...as data from the [International] Electricity System Operator clearly shows (sic), it’s nuclear and gas plants that are responsible for the lion’s share of increases. 
"Clearly."
It is time for a refresher.

Some background on the data I'll share. The 2015 Annual Report from the office of The Auditor General of Ontario included a chapter on "Electricity Power System Planning." The entire chapter contained a wealth of information and continues to be cited frequently, but for those chasing hard numbers one particular star of the work was a figure revealing the quantity, and cost, of generation from various sources, inclusive of not only the larger generators frequently reported by the IESO (the "I" is not for international, but it is the electricity system operator), but also the seldom reported distributed generation - which is where most solar exists.

The freedom-of-information requests handed to me included this request:
Breakdown of Generation Cost by Energy Sources for the years 2007, 2008, 2009, 2010, 2011, 2012, 2013 and 2015. The Breakdown for 2014, which was included in the Annual Report of the Auditor General of Ontario, is attached as reference.
The data table that follows responds fully with the request - I have only reformatted it:

Monday, March 13, 2017

Not another Long-Term Energy Plan

The Minister of Energy will produce a Long-Term Energy Plan (LTEP) in the not too distant future. I've offered commentary during the planning period of two earlier LTEPs, in 2011 and 2014, but my advice this time didn't require complying with any official input period because it would be officially rejected anyway.

My advice on preparing 2017's Long-Term Energy Plan is simply this: don't.

I've been asked for thoughts on the new LTEP a couple of times, so I'll present some here primarily for the frequent readers of my work, including some authentic public servants, and hopefully also for a Minister of Energy - although probably not today's.

The primary reason for individuals to avoid the LTEP process is it's been a gimmick - a tool to present Ontario Liberal Party (OLP) policy to the electorate as if it was professionally and independently developed. The connection of professionally developed policy and elections began in 2007. The OLP had come to power in 2003 aided by displeasure over the handling of the electricity file by the previous Progressive Conservative (PC) government. It worked quickly in redesigning the sector to include a professional planning body, the Ontario Power Authority (OPA), which was tasked with producing an Integrated Power System Plan (IPSP):
  1. The initial IPSP was submitted to the Ontario Energy Board for consideration in August 2007, just in time for the OLP to campaign on the document for the October 2007 election,
  2. the first LTEP was put out early in 2011 to be the basis for an IPSP, and the OPA did have a draft IPSP on the minister's desk prior to the election in October 2011, although the OLP never did let that draft into public view,
  3. the next LTEP came out late in 2013, and served as the basis for OLP electioneering on energy in the election that followed in June 2014.
Participating in the development of an LTEP is participation in developing an OLP election platform.

The occupant of the office of the Minister of Energy is currently Glen Thibeault, signalling this LTEP will be as politicized as ever. Last May a report indicated then Minister of Energy Bob Chiarelli, "at loggerheads" with "Environment Minister Glen Murray ...over the possible effect [of carbon costs due to the Climate Action Plan] on electricity prices." At the time Glenn Thibeault was Murray's Parliamentary Assistant, so the introduction of Thibeault as Minister of Energy, in June 2016, was confirmation Chiarelli's concern for electricity pricing had lost the battle. During his first 6 weeks as Minister of Energy Thibeault directed the construction of a $1.4 billion hydro line to service 10,000 distant consumers and refused to recognize electricity pricing as a crisis.

Eight months later, Thibeault sat with the Premier at a press conference due to a crisis. It's unclear if the crisis was electricity pricing or their party's polling numbers, but the actions taken to resolve the crisis don't address the fundamental factors that drove prices higher - so it's probably the polling.

Ontario's next Long-Term Energy Plan is to be produced by a rookie minister three-quarters of the way through his first year in the office, during which he's moved from not seeing a problem with costs to burdening a future generation in order to offer 25% off electricity pricing to 2018's voters.

Friday, December 30, 2016

Nuclear Ontario - and giving electricity away

first posted on cold air currents.

Since I posted Reliable Electricity Generation Capacity declining in Ontario the IESO's NPCC 2016 Ontario Interim Review Of Resource Adequacy was published.
It's exciting stuff:
The Independent Electricity System Operator (IESO) submits this assessment of resource adequacy for the Ontario Area in accordance with the NPCC Regional Reliability Reference Directory #1, “Design and Operation of the Bulk Power System.” 
Spoiler alert!
The report concludes Ontario's system can meet Loss of Load Expectation (LOLE) criteria for the 2017 to 2020 planning period once Emergency Operating Procedures (EOP) are assumed. EOPs are indicated to be essentially 1/3rd public appeals to reduce consumption, and 2/3rds voltage reductions.

Phewff.

I wrote "With the exception of 2013 the capability at peak has declined every year since 2010, despite IESO-connected generator capacity being greater now than it was six and a half years ago," so I thought it only fair I offer a brief analysis of how the IESO is meeting the reporting requirements for resource adequacy - and the repercussions of how they are doing so.

Sunday, December 18, 2016

Reliable Electricity Generation Capacity declining in Ontario

Ontario's electricity sector provided some material worthy of commentary over the past week.

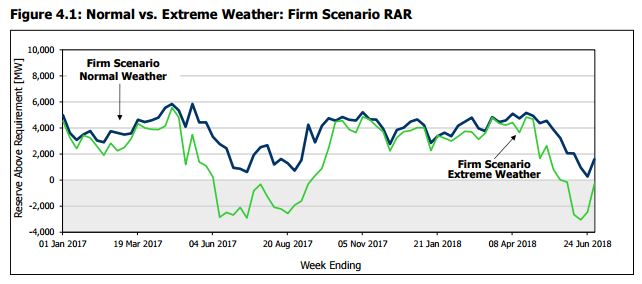
A new 18-month Outlook issued by the IESO (the province's system operator) begins cheerfully enough:
The outlook for the reliability of Ontario’s electricity system remains positive for the next 18 months, with adequate generation and transmission to supply Ontario’s demand under normal weather conditions.
This is reassuring - unless there's a particularly hot run of weather:
Under extreme weather conditions, the reserve is below the requirement for 19 weeks over the entire Outlook period, with the largest shortfall being approximately 3,000 MW.
19 weeks in 18 months is 24% of the time - corresponding with the quarter of the year known as summer. In a province introducing carbon pricing in January (poorly), apparently the government is unconcerned about local warming.

firmscenario

There has been similar language in previous 18-month outlooks:
During the Outlook period, the...forecasts show that Ontario’s available generation exceeds projected demands...there are periods when Ontario’s available reserves are forecast to be ...below the IMO’s required planning reserve levels.
That from the Outlook produced in April 2002.

I'm sure today's Wynne government finds comfort in how well Ontario's system coped with heat waves in 2002 and 2003 - despite their braying indicating the opposite.

Monday, January 4, 2016

2015 Ontario Electricity Data Summary Part 2: component costs, and cost shifting


The electricity sector data widely communicated by the system's operator (the IESO) is increasingly inadequate for analysis of cost and demand trends in the province. This post needs to utilize more obscure data, and the creation of some data through estimates, in order to demonstrate the causes of overall higher prices and the shifting of costs to the smallest consumers of electricity. 2015 continues a trend of rising overall electricity costs, and the increases are amplified by 50% for small consumers.

Consumers can be broadly grouped into three groups: exporters, Class A and Class B. In 2015 a new website appeared that does provide a quarterly report indicating the much different pricing for Class A consumers ("large electricity consumers"), and all other domestic consumers - Class B.
Up to the end of the September the total pricing for the classes was quite different: Class A had averaged $6.24 cents per kilowatt-hour ($62.40/MWh), which was 37% lower than Class B's 9.89 cent/kWh average.

To understand the cost drivers it's useful to first examine the difference between the forms of generation the IESO considers "Ontario Demand", and the metered consumption of Ontario consumers.
The IESO provides, upon requests, figures for "consumption" by the consumer classes defined by the global adjustment mechanism/s. With these figures, and the breakdown of the global adjustment totals by class A and class B published by the IESO, it is possible to recreate the reported average commodity rates. The widely cited "Ontario Demand" refers to demand for supply from transmission connected (Tx) generators. Other generators are connected within distribution grids (Dx). Consumption figures for December won't be available until after the global adjustment totals are finalized in mid-January, but we have enough data to estimate 2015 and demonstrate that over the past 5 years "consumption" in Ontario has gone from being less than "Ontario Demand" to exceeding it.

The change in the the difference between Tx generation ("Ontario Demand") and consumption means that generation is increasing within distribution (Dx) networks. It should be expected that Dx generation data be reported along with Tx data to properly communicate component supply costs.

Monday, August 24, 2015

IESO Reporting Challenge: concerning Fig 23

Everything is political.

Working with data, the political introduces itself largely in reporting. The planning, structuring and collection of data all involve organizational power structures, but in an intelligent system all are dependent on operations and/or the current, or envisioned, demand for reporting.

I usually find reporting to be the least enjoyable aspect of working with data. Querying data can be very informative, and much of my writing takes one aspect of a data set and explores it with words. Reports are often designed for other people, to their design - particularly executive reporting, which is designed for a quick hit on the status presented in a format the executive are comfortable with.

The IESO eventually posted a report for June, weeks later than usual. That is interesting in itself, as it implies the report is designed for an audience the doesn't need it any particular time. I can't think of a benefit of variable intermittent reporting (VIR) in Ontario's electricity sector - must be part of a bigger trend to variable intermittent stuff.
Whoever the important audience is for VIR, the June report had at least one new graphic which must be for them:


This is not the format of reporting on generation I would expect the people reading through a summary report to find relevant. The IESO's long-standing Figure 18, "Monthly Energy by Fuel Type," is a graph of monthly production in the same stacked chart format, but for coherent categories; nuclear, hydro, gas/oil, solar, wind, biofuel and imports. I would think normal people looking at a monthly report might like cost information for the same categories they receive production information.
Like this:

Sunday, May 24, 2015

"Stakeholders" destroying the viability of Ontario's electricity market

Ontario's electricity rates are rising for most, and that's not due to external factors nearly as much as the deliberate policies of the Ontario government couple with the performance of the system operator (IESO). I've written recently on traders in the Ontario market benefiting from low Ontario electricity prices, and on suppliers manipulating government policy and practices making larger entities more influential. This post will focus on the "Class A" global adjustment which, because it works to eliminate any possibility of a market in Ontario functioning as a tool to indicate the adequacy of supply levels, is the worst "stakeholder" driven policy of all.

On August 17, 2010, the Ministry of Energy news release on the planned 'Class A' scheme to reduce electricity costs for the province's largest consumers of electricity stated:
Ontario is proposing to help the province's largest industrial companies and manufacturers conserve energy in a way that will have little to no impact on electricity bills for Ontario families.
I've checked.
They were wrong.

Since the process was introduced for 2011 I estimate the direct "little to no impact" has been over $2 billion and has grown to a cost of over $750 million a year. [1] This direct cost shift has an impact of about 0.66 cents/kWh ($6.64/MWh), which makes it essentially a new charge equivalent to the retiring, for 2016, debt retirement charge.

Despite the high cost of the class shift, which will be explained further, I'll argue there are secondary impacts from the behaviour encouraged by the mechanism.

Friday, May 15, 2015

Better Reporting of Ontario's Electricity Generation

How much electricity is generated in Ontario from different sources?

It’s a question that’s difficult to answer, but using both the IESO’s summary of 2014 electricity production (IESO data), and the Ontario Energy Board’s Ontario’s System-Wide Electricity Supply Mix: 2014 Data (OEB data) provides a far better estimate of actual production than is generally circulated.

The IESO data is often cited for supply and demand figures in Ontario, but it provides neither: the IESO reports on generators attached directly to the transmission grid. Generators contained within the domain of Ontario’s multiple distribution grids are called embedded generation, and escape most IESO reporting.

These are the IESO’s figures for “Grid-Connected Electricity Production” the past 2 years:


Add the numbers for each of 2013 and 2014 up and generation is essentially unchanged at 154 TWh.

To estimate “embedded” generation a look at the OEB data is necessary because it “Includes both Tx (direct) and Dx (embedded) connected generation”:

Tuesday, December 16, 2014

November 2014 Sets another record—wind blows harder than ever!

By Parker Gallant and Scott Luft
[first appeared at Wind Concerns Ontario]

It was another “wow” month for the electricity sector in Ontario for November: power generation from wind set a new record of 879,000 megawatt hours (MWh). The cost for that production alone1 added over $108 million to ratepayer bills and coupled with curtailed wind production of over 70 thousand MWh cost ratepayers about $116 million dollars in a month that valued all generation at about $1.1 billion.2 


Wind made up 6.6% of total supply and represented 10.7% of what the market valued all generation at, but it also drives down the market rates which transfers costs to the smaller Ontario ratepayer. No small wonder why our electricity rates are continuing their relentless march upwards!

The Global Adjustment didn't set a new record as it did in October, but at $870.2 million it is the second highest on record, as is the $82.32/MWh class B rate. Coupled with the $16.49 HOEP (Hourly Ontario Energy Price), the “bare bones” price for the commodity will be 9.9 cents/kWh for most Ontario ratepayers. That price is before inclusion of all other nickel-and-dime charges such as regulatory, debt retirement, delivery, HST, etc.

Friday, April 27, 2012

Ontario replaces Independent: Weakly Electricity Sector Downgrades


I posted the latest weekly reporting figures this afternoon, and the data, fittingly, indicates a new record.  Week 16 is notable as the first week with Ontario demand growth over the previous year (Easter weekend was in 2011's week 16) - but the growth average for Ontario's demand was only 305MW/h, whereas the growth in net exports was 828MW/h.  The increase in net exports, combined with pricing remaining a third lower than in 2011, caused the export subsidies, by my estimation, to surge to record levels - for the third week in a row.

The Canadian Press shared this important bit of news this week:
TORONTO - Energy Minister Chris Bentley hasn't abandoned the idea of having a "real name" for the merger of the Ontario Power Authority and the Independent Electricity System Operator after all.
Bentley complained the energy sector is full of agencies known by acronyms like the OPA and IESO when he announced the planned merger of the two electricity planning agencies.
The minister said at the time he wanted the new agency to have a real name, but in legislation introduced today, it is known as the Ontario Electricity System Operator, or OESO.
In rearranging the Ontario Power Authority and the Independent Electricity System Operator,  Minister Bentley kept on 4 of the words: Ontario Electricity System Operator (OESO) is the working title.

Independent
Power
Authority

These words the Minister extinguished.

Monday, April 9, 2012

Penthouse Fora: Personal thoughts on the IESO's Year

Ontario's Independent Electricity System Operator (IESO) released it's 2011 Annual Report just prior to the Easter weekend.    It didn't get much attention, because it didn't say anything.

That should be noteworthy.


Some quick estimates for an alternate 2011 Annual report:
The market the IESO is tasked with operating shrank from 157TWh to 154TWh, with the Ontario demand portion shrinking from 142.2 to 141.5.  The price drop was more severe, with the Hourly Ontario Energy Price (HOEP) dropping to $31.46/MWh from $37.85 in 2010.  Exports shrank less than imports did.  Because Ontario has a Global Adjustment mechanism that recovers the difference between the prices guaranteed to producer and the market rate, these numbers indicate Ontario's ratepayers had over $450 million added to their costs to recover the difference between the average cost power was purchased from generators at ($68 including other systems cost), and what it was dumped at in adjacent markets ($31.46).   Looking at it another way, in 2011 prices for Ontario customers rose by 10% while prices for export customers dropped by about 20%.

Saturday, February 25, 2012

At The End of the IESO 18-Month Outlook

"Though energy from coal in 2011 was less than three per cent of total output, at times the flexibility of coal units is beneficial."
"The availability of the remaining coal fleet, although running at reduced levels from previous years, provides flexibility which is very beneficial to the reliable operation of the Ontario power system."


Ontario's Independent Electricity System Operator (IESO) released it's latest 18-Month Outlook on Friday, as they do quarterly along with the supporting documentation. I've always found the organization exemplary in making data available as widely as possible, and noted Steve Paikin's blog entry yesterday also showed admiration for the behavior of this public organization. The report book-ended a week that started with the firing, without cause, of the suddenly former chief of the Toronto Transit Commission (TTC), general manager Gary Webster. I don't follow Toronto's politics closely, but I was e-mailed, along with the link to an article in the Toronto Star, the suggestion a chill could run through many bureaucracies following the firing of Mr. Webster. Mr. Webster was unwilling to make a case that the Mayor was ordering him to make. I'm certain there are many shades of grey to the TTC situation, but I think the bureaucrat must exist somewhere between resisting to undertake the ridiculous, and placating the powers beyond the silo or their expertise while arguing their educated views to represent the public responsibly. I prefer to work with base data, but the 18-month outlook is always informative, and I believe, very subtly, rebelliously/responsibly, independent.

Monday, December 12, 2011

Secret Deals between Public Power in Ontario and Quebec


There have long been suspicions that Ontario has been dumping hydroelectric production.    Earlier this year a report  indicated Americans were generating power with the Ontario water allocation we were unable to use.  As the year progressed and water levels of the great lakes remained well above 2010 levels, it became apparent that Ontario’s hydro levels were producing at new lows as the year progressed.  I reviewed generation figures by site for September, and noted a big drop in the output from the unregulated segment of the Ontario Power Generation (OPG)  Ottawa/St. Lawrence Plant Group .  I made inquiries as to whether the water sharing agreements from the Niagara River were mirrored for rivers shared with Quebec at the time, which went unanswered.  Now I believe I’ve stumbled upon the proof that we have agreements with Quebec resulting in exports, and generation, that are not being reported.