
It’s a question that’s difficult to answer, but using both the IESO’s summary of 2014 electricity production (IESO data), and the Ontario Energy Board’s Ontario’s System-Wide Electricity Supply Mix: 2014 Data (OEB data) provides a far better estimate of actual production than is generally circulated.
The IESO data is often cited for supply and demand figures in Ontario, but it provides neither: the IESO reports on generators attached directly to the transmission grid. Generators contained within the domain of Ontario’s multiple distribution grids are called embedded generation, and escape most IESO reporting.
These are the IESO’s figures for “Grid-Connected Electricity Production” the past 2 years:
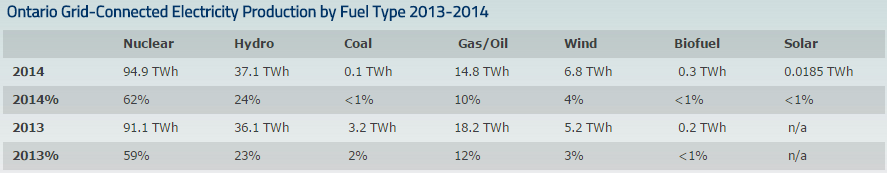
Add the numbers for each of 2013 and 2014 up and generation is essentially unchanged at 154 TWh.
To estimate “embedded” generation a look at the OEB data is necessary because it “Includes both Tx (direct) and Dx (embedded) connected generation”:
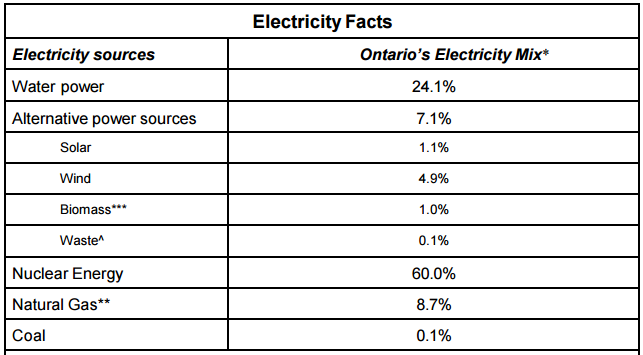
The perceptive will note solar has risen from near nil to 1.1% of supply.
To put some generation numbers to the OEB’s percentages it’s useful to recalculate total generation from the IESO’s figure for nuclear generation (assuming there’s no embedded nuclear generators).[2]
- For 2014, 94.9 TWh (nuclear) is 60.0% of 158.2 TWh.
- For 2013, 91.1 TWh (nuclear) is 57.9% of 157.3 TWh
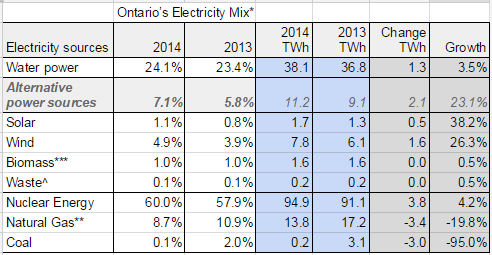
There’s a difference in these figures to the IESO’s data, totalling 3.3 TWh in 2013 growing to 4.2 TWh in 2014. Wind is 1 TWh higher (for 2014), as is hydro/water, and solar is 1.7 TWh more. Recalling that the IESO showed no change in generation between the years, it can also be concluded that the IESO’s “Tx (direct)” reporting misses the growth which is entirely in “Dx (embedded)” generation. [3]
Lastly, grabbing predicted pricing for 2014 for the OEB’s November 2013 Regulated Price Plan documentation, we can estimate the cost of this usually invisible embedded generation.
- At $ 48/MWh, 1.0 TWh of hydro is $ 48 million
- At $120/MWh, 1.0 TWh of wind is $120 million
- At $489/MWh, 1.7 TWh of solar is $831 million
The omission of embedded generation is an increasingly severe shortcoming of most reporting on electricity in Ontario.
End-notes
- I do estimate all generation in the province hourly, which supports not only my work on this blog but drives the reporting at my data site. The process documented in this blog points to my estimates putting solar a little higher than it actually was in 2014 - as I suspected when writing Estimating production from Ontario's solar panels
- I stole the idea from Bruce Sharp.
- There is a discrepancy for natural gas, where the OEB reports less use than the IESO. This is explained in the footnotes to the OEB data, where co-fired units (biomass and natural gas) are treated as biomass by the OEB but as “gas/oil” by the IESO.
559CFFCC
ReplyDeleteOrdu Esçort
Maraş Esçort
Bitlis Esçort
Niğde Esçort
Iğdır Esçort
Bayburt Esçort
Çorum Esçort
Bingöl Esçort
Şırnak Esçort
C4272CDA
ReplyDeleteArdahan Esçort
Muğla Esçort
Sinop Esçort
Tokat Esçort
Ordu Esçort
Çorum Esçort
Isparta Esçort
Aydın Esçort
Şırnak Esçort