Showing posts with label Energy Information Administration (EIA). Show all posts

Monday, July 3, 2017

Premier Wynne's neglecting business

"Small business optimism in Ontario took a nosedive in June."

So begins the Ontario section of the Business Barometer from the Canadian Federation of Independent Business (CFIB). The members of the CFIB have legitimate reasons to be pessimistic. In this post I will demonstrate the indifference to the needs of employers in the current Ontario government's electricity policies, with a particular focus on the unfairness of the so-called Fair Hydro Plan.

I recently spoke with Jocelyn Bamford of the Coalition of Concerned Manufacturers. The group has been in the press due to electricity cost concerns, but other concerns are newly presented to these employers, by the provincial government. I perceive 3 primary concerns:
  1. Electricity
  2. Cap and Trade
  3. Labour costs
I'll begin with electricity. 

As context for the following information on rates in Toronto, the U.S. Energy Information Administration (EIA). American data shows U.S. residential consumers pay 86% more for a unit of electricity than industrial consumers, and about 20% more then commercial consumers. The definitions of groups don't work well in comparing to Toronto, but note small consumers pay, on average, the most per unit, and largest the least. 

On July 1st rates dropped for Ontario consumers charged on Regulated Price Plans (RPP), due to legislation dubbed a "Fair Hydro Plan" (FHP). I pulled average consumption levels for residential and other customers of Toronto Hydro from the spreadsheet accompanying the Ontario Energy Board (OEB) 2015 Annual Yearbook of Electricity Distributors, calculated average monthly figures and fed those into the OEB's Bill Calculator for Toronto Hydro customers. For non-RPP consumers (Class A and B) I found a Toronto Hydro presentation considering monthly figures for one consumer (on slides 19 and 20). There are some issues the presentation data, but the 18 cents/kWh for Class B consumers is what I expected.


Not only do "Class B" industrial users not enjoy preferential electricity pricing, they probably pay more than the average Toronto household. This is exceptionally rare. I can find instances of American utilities charging industrial consumers more than residential ones, but nothing for a decade among utilities the size of Toronto Hydro with one notable exception: Niagara Mohawk Power Corp. [1] Ontarians might be interested in knowing the territory of that utility includes the American cousins of Niagara and St. Lawrence river power plants (in Canada, Beck and Saunders). Legal cases have established set uses for the power produced by the big public hydroelectric plants in the New York. Regardless, it's been 6 years since even that utility saw residential rates lower than industrial ones.

Wednesday, March 7, 2012

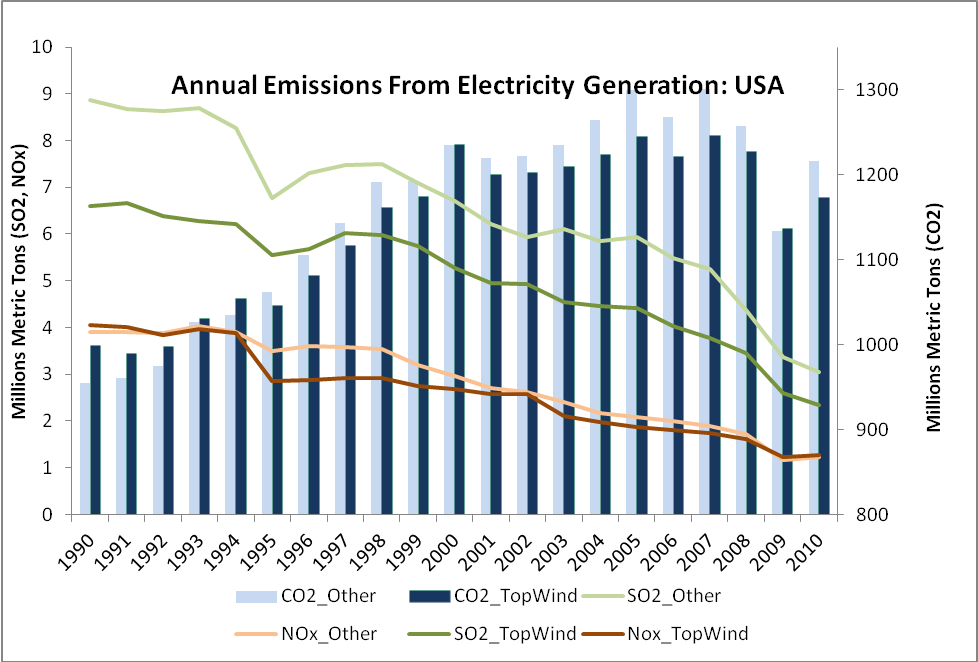
Wind Is Not Reducing Emissions

Top Wind States are the 20 states with over 930 GWh from wind, in 2010
Clearsky Advisors put out an article, a couple of months ago, built on US Energy Information Administration (EIA) data, comparing rate increases between 2005-2010, and total renewable energy capacity ‘of solar PV and wind.’ The same company put out a report in 2010 to claim spending huge sums on solar was great because it took all kinds of hours of work to create a Watt that way. That report went so well in 2011 the wind industry paid them to do the same. That report still gets trotted out by the ‘green’ lobby as proof of something or other whenever they wish to obfuscate - which, in Ontario (and BC and Alberta) they are doing this week to prevent rural governments from managing rural jurisdictions (only in Ontario).

Thursday, November 17, 2011

Reviewing Ontario's Feed-In Tariff: Part 2


The current feed-in tariff (FiT) review in Ontario provides an excuse to explore some larger topics - like markets, efficiency, climate change and polices intended to lower emissions. FiT programs will drive up the price of electricity which threatens to reduce the movement of energy consumption towards increased use of electricity - a necessity in the eyes of many if overall carbon emissions are to be meaningfully reduced. FiTs, especially those offered with protectionist requirements, discourage trade in electricity, and that, in turn, further reduces efficiency and, therefore, affordability.

The premise that increased electricity is necessary for a low-carbon world has been repeatedly emphasized this year, including in reports on reducing greenhouse gas (GHG) emissions in California, and even more recently in a report, “Scottish Energy 2020?”, put out by the Institution of Mechanical Engineers.  That report noted, “Electricity is actually projected to be the smallest component of Scotland’s energy demand (heat and transport energy being greater)...”  

That sent me to the figures at the back of Part 3 of Canada’s latest (2009) National Inventory Report, to calculate per capita emissions for 3 categories with large residential components.   The resulting graphic shows per capita emissions in Ontario and Quebec (‘Electricity and Heat’ is almost entirely electricity in both provinces, as the ‘heat’ referred to here is primarily the H in CHP - which is essentially absent in these provinces).  I’ve shown emissions from light vehicles, including light trucks.   Most are aware of Quebec’s hydroelectric capacity, but I’m not sure many understand the implications of heating with electricity.  In Ontario, 2011 is likely to see more emissions from heating than from all electricity generation (and both will be dwarfed by the use of light vehicles).

Thursday, July 14, 2011

The Fog Around Emissions From Electricity Generation

I've been mulling over tackling this topic since the ENGO's launched a campaign, to support the Green Energy Act and related FIT lotteries, built around implications of increasingly large heath costs due to the use of coal plants - despite a 90% reduction in the use of those coal plants. Recently there's been a great deal of news related to the points I thought were pertinent, the primary one being that if pollutants from electricity generation are decreasing, and respiratory problems are increasing, you should probably look at other urban issues,

Wednesday, May 4, 2011

Ontario Pays Tribute to Our American Neighbours

A month ago I wrote on data from the U.S. Energy Information Administration (EIA), noting it indicated the largest wind production states were not reducing emissions as quickly as the other states.  One notable exception was New York state, which is amongst the best performing states in reducing CO2, SO2 and NOx emissions since 1990.  I’ve been meaning to revisit this once more by comparing the generation, and consumption, histories of New York state, and Ontario.  Premier McGuinty jogged my memory when I read an article stating Mcguinty had argued, “The province imported a net $400 million worth of electricity in 2003, while last year it made a net $300 million from its sale.” 
The only way Ontario could have made anything from the sale is if the product had zero value – because $300 million is about the total received over the course of the year from the net exports of 8.8 TWh (that’s about $34/MWh).   In 2010 Ontarians paid about $65/MWh for the electricity we used (the charge per/kWh is an increasingly small portion of our total bills).

Monday, April 11, 2011

The Conference Board of Canada Fails To Make a Case for Investment in Canada's Electrcitiy Infrastructure


Building a Case For Investment, is a report prepared by the Conference Board of Canada. The report, (which I'll refer to as simply The Case) contains some some questionable assumptions, but a lot of research was put into the document, and it's worth the second look for some relevance. The written text is far less meaningful than the subtext included with the figures for generation. That subtext shows the Conference Board picking Canada's traditional sources as winners (large hydro and natural gas), and throttling the wind monster.

Wednesday, March 2, 2011

Reviewing EIA data: Lessons for Wind, Nuclear, and Reduced Production

I’ve been looking outside my little setting in the province in Ontario for data indicating signs of intelligent life in the electricity policy universe.  The U.S. Energy Information Administration (EIA) provides a wealth of data, and forecasts.  I’ve started working with a number of tables/spreadsheets for the period 1990-2009.   The first thing I checked was for the correlation between wind and emissions reduction – but that initiated some queries to uncover the best performing states in terms of reducing emissions, and that led to some others to find out what metrics did relate to reduction of emissions.   Most of the data I formulated compared 2009 to 1997[i].  I chose 1997 because it was the year the Kyoto Protocol was negotiated – the base year for that protocol is 1990, but I’ve learned that was a negotiated date long after it had passed.  After a lot of work, the conclusions from the data are things we knew 25 years ago.  Generating less energy reduces CO2 emissions – as does producing a greater share of electricity with nuclear.