Monday, March 12, 2012

Ontario's Electricity Price Hits Record Low

This post has been updated following posting of IESO Daily Market Summary

Based on available hourly data - all are estimates
The IESO's daily report for Sunday March 11 shows the average hourly electricity price below $-20/MWh for the first time ever (the weighted average is $-20.42/MWh).

The previous record, $-17.54, was Sunday, August, 28, 2011, and many of the characteristics of that debacle existed on the latest Sunday too - the main one seeming to be the disinterest in external markets in allowing Ontario to dump excess production - at any price.

Friday, March 9, 2012

Wind Pushes Out Nuclear: Week 9 Reporting

The week 9 reporting, for Wednesday February 29 - Tuesday March 6, is now posted at the IESO site, and I have updated my version of weekly reporting too.  The overall weekly demand and pricing figures show the same trends as the past several weeks have shown, but looking closer at the data the developing break-up of Ontario's electricity plan is indicated.

Wednesday, March 7, 2012

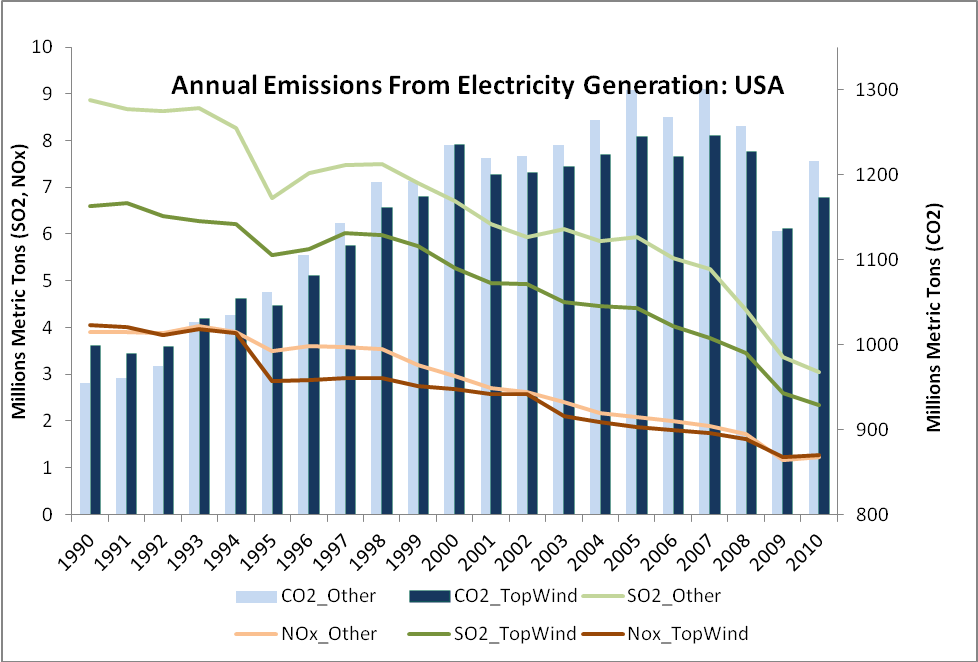
Wind Is Not Reducing Emissions

Top Wind States are the 20 states with over 930 GWh from wind, in 2010
Clearsky Advisors put out an article, a couple of months ago, built on US Energy Information Administration (EIA) data, comparing rate increases between 2005-2010, and total renewable energy capacity ‘of solar PV and wind.’ The same company put out a report in 2010 to claim spending huge sums on solar was great because it took all kinds of hours of work to create a Watt that way. That report went so well in 2011 the wind industry paid them to do the same. That report still gets trotted out by the ‘green’ lobby as proof of something or other whenever they wish to obfuscate - which, in Ontario (and BC and Alberta) they are doing this week to prevent rural governments from managing rural jurisdictions (only in Ontario).

Sunday, March 4, 2012

Class A Absurdity

My previous blog entry described the government's creation of a separate class of customer, which I put in the context of the need to get electricity pricing for industry competitive with other jurisdictions. I carefully referred to that methodology as 'absurd.' Today a review of why it is absurd, why it is bad that it is absurd, and why Ontario is worse off because absurd is tolerable in our electricity system.

The creation of the Class A customer, one with "average monthly peak demand in excess of 5 MW," and the methodology for setting their rates - " the five hours, occurring on different days, in which the greatest number of Megawatts (MW) of electricity were withdrawn by all market participants" - are set out in the Environmental Registry entry for the change to the global adjustment mechanism:  
The proposed changes to the global adjustment mechanism would provide large consumers with a strong incentive to reduce consumption at critical times, consistent with the government’s commitment to creating a culture of conservation. By reducing peak demand, the proposal is expected to avoid costly investments in new peaking generation resources and imports of electricity from jurisdictions reliant on coal-fired generation.
Absurdity #1:  There is an Environmental Registry entry for the change (greenwashing).

Saturday, March 3, 2012

Demand Destruction: Economic Reality And Ontario's Electricity Policy

“The findings reflect reasonably consistent patterns of price response. At the national level, electricity price elasticity of -0.13 in the short run and -0.42 in the long run have been estimated.” 
I first quoted that sentence, from a 2010  Electric Power Research Institute (EPRI) analysis, in June of last year, in an article related to a bureaucrat's report.  Recently, another bureaucrat of sort, Don Drummond, released a report that offered some advice that provides a timely excuse to revisit the price elasticity of demand with respect to electricity.
Statistics Canada CANSIM data fromTable 329-0073

The price elasticity is the figure computed by dividing the change in demand by the change in price - if demand drops 10% when the price rises by 100% (doubles), the measurement is -0.1, which is a frequently noted figure for electricity. The number would vary along the price/demand curve, so all figures can only be guides.  The EPRI study noted short term as; "a time frame of less than three to five years, during which consumers do not have time to make investments in new capital stock."  In clear terms a price increase would have a greater impact in the longer term, when consumers have time to make operational decisions based on the new price levels.

Friday, March 2, 2012

Week 8 Update: Hockey Night in Ontario

The weekly report has been updated to display week 8.
Same outcomes again, with demand down, Hourly Ontario Energy Price (HOEP) off by about a third and moving in a narrow range.
For the second week the highest price of the week was a spike at 7pm Saturday, as demand went up as wind production dropped.  It seems something is both attracting television viewers and sucking the air out of sections of the province.

Monday, February 27, 2012

The Myth of the horse racing subsidy

My MPP finally got mentioned in the Globe and Mail
That Dalton McGuinty would even consider no longer using slot-machine revenue to prop up an otherwise money-losing racing industry, veteran MPP Garfield Dunlop charged, is proof that the Premier “hates rural Ontario.”
             -Adam Radwanski
Ah yes ... the horse racing subsidy.

This from a brief mention in the recent report of the Commission on the Reform of Ontario's Public Services:
In addition to revenues from wagering, since the late 1990s the industry has benefited from a provincial tax expenditure (a reduction to the provincial pari-mutuel tax) and a percentage of the Ontario Lottery and Gaming Corporation’s gross slot revenues that together are worth an estimated $400 million in 2011–12. Over the past 12 years, approximately $4 billion has flowed through 17 racetracks to support purses, racetrack capital improvement and operating costs.  - page 316
Later, on page 408, the report would put the shocking tag of $334 million in 2009-2010, an amount Dwight Duncan would note; “would pay for over nine million hours of home care or insulin pumps and supplies for five years for almost 17,000 people,” Mr. Duncan said.  - February 13, 2012

Saturday, February 25, 2012

At The End of the IESO 18-Month Outlook

"Though energy from coal in 2011 was less than three per cent of total output, at times the flexibility of coal units is beneficial."
"The availability of the remaining coal fleet, although running at reduced levels from previous years, provides flexibility which is very beneficial to the reliable operation of the Ontario power system."


Ontario's Independent Electricity System Operator (IESO) released it's latest 18-Month Outlook on Friday, as they do quarterly along with the supporting documentation. I've always found the organization exemplary in making data available as widely as possible, and noted Steve Paikin's blog entry yesterday also showed admiration for the behavior of this public organization. The report book-ended a week that started with the firing, without cause, of the suddenly former chief of the Toronto Transit Commission (TTC), general manager Gary Webster. I don't follow Toronto's politics closely, but I was e-mailed, along with the link to an article in the Toronto Star, the suggestion a chill could run through many bureaucracies following the firing of Mr. Webster. Mr. Webster was unwilling to make a case that the Mayor was ordering him to make. I'm certain there are many shades of grey to the TTC situation, but I think the bureaucrat must exist somewhere between resisting to undertake the ridiculous, and placating the powers beyond the silo or their expertise while arguing their educated views to represent the public responsibly. I prefer to work with base data, but the 18-month outlook is always informative, and I believe, very subtly, rebelliously/responsibly, independent.