
Fortunately it's only twice a year the OEB sets the Regulated Price Plan (RPP) rates for retail consumers in Ontario, so the annual increase isn't over 700%, but it isn't 2.4 either.
There's a couple of RPP plans; an old "tier" plan which charges less for the first tier of consumption, and the now more common time-of-use (TOU) scheme. Both RPP versions have rates set to average the the same amount; the calculations for that amount are communicated in a Regulated Price Plan Report.
Rates are set to average $92.50/MWh (9.25 cents/kWh) as of May 1, 2014; last year rates moved to average $83.95/MWh on May 1st.
Here's how the OEB's press release describes that annual 10.2% increase:
The price for consumers is increasing by approximately $2.83 per month on the “Electricity” line, or about 2.4% on the total bill, for a household with a typical consumption pattern of 800 kWh per month.
.png) |
| Ontario's rates are up near 10% a year since 2008 US rates are not [1] |
The rise in RPP rates has been a feature for over half a decade in Ontario. From 2008-2013 RPP rates increased an average of about 8.5% a year: US rates, over the same period, about 0%.
The OEB disguises the reason for the current hike in its news release:
The market price of natural gas has risen during the long winter...Let's dismiss the natural gas pricing story (again); the rate increase on May is tempered by a $1.87/MWh credit to clear the variance account built by recovering more than anticipated during the prior rate plan period. There's a neat story in how soaring gas prices didn't lead to higher than expected electricity increases, but it's not relevant to the current rate increases.
The forecast for higher costs includes more generation in the next 12 months from sources including renewables.

The equation may look intimidating but it simply communicates that the total cost for RPP plan customers will be:
The variables A, C, E and G are the costs of contracted/regulated supply; whatever isn't recovered by the market price (B,D and F) comprises the global adjustment, but that's irrelevant to the RPP rate. This is what variable A, C, E, and G are in the current RPP document, and the one a year ago, and what has changed to increase rates over 10%:
- the value of the electricity they use at the market price (ie. HOEP), plus,
- their share of the global adjustment (calculated by variables within []), plus
- whatever deficit is in the variance account.
.png)
This is not complicated at all: one variable increased, and it represents, "the amount paid to the OPA with respect to its payments under certain contracts with renewable generators."
This is an increase in excess of 10% that would have been greater if not for planning spending on all other supply to be down. [2]
Perhaps "planning" is the wrong word. Ontario Power Generation (OPG) not only has a very significant rate increase application into the OEB, for July 1st, that rate increase indicates a directive to move a lot more hydro into the "prescribed"/regulated hydro. Were the OEB to allow an OPG rate increase it would be the first since the RPP rate inflation kicked in after 2008.
OPG's prescribed rates have not changed in a period where US pricing remained flat and Ontario's RPP rates went up 48%.
Stick OPG rate request ignored on a press release, along with notification the annual inflation for the portion of the bill being increased is over 10%, and that is due entirely to the contracting of renewable energy.
ENDNOTES
1. The Ontario rates are for only the electricity/commodity, and don't include transmission, distribution, regulatory, stranded debt and tax charges; the U.S. Energy Information Administration (EIA) reports all costs, so the closest comparison to Ontario's commodity rate is the industrial rate: the average for all US sectors has risen only 3.5% from 2008-2013 (from just under to just over 10 cents/kWh)
2. While the variance account does lower the RPP for the next rate period, it does not reduce it as much as the variance account reduced the RPP rates one year earlier. The hike due to renewable does look to be higher than 10%, but not significantly higher.
3. Spreadsheet with the figures and the graphs in this post can be viewed on the web
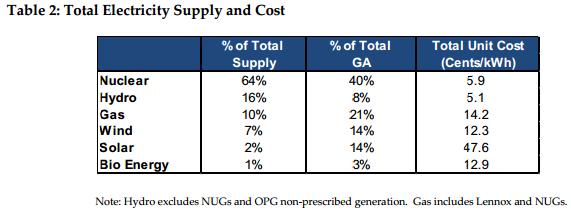
4. My previous post contained a table showing the combination of wind, solar and natural gas generation comprising 48% of the global adjustment. The OEB RPP report shows them adding to 49%.
Must be a rounding thing.
No comments:
Post a Comment