The OEB yearbook data isn't strictly comparable to data developed by the Independent Electricity System Operator (IESO). But looking at trends the growing discrepancies in summer peak demand appears to be quite extraordinary. In this first graphic the total of the summer peak demands at all local distribution companies (LDC's) are shown against the peaks of the IESO's "Ontario Demand" (which is actually demand for supply generators on the IESO-connected grid). I've added a, "Revised LDC peak" which I calculated to attempt to make the data from the yearbooks from 2016-2018 comparable to previous yearbooks' data.
Changes in procurement and consumer demand management explain why the gap is narrowing (if not eliminated) in the reporting of peaks in the IESO's "Ontario Demand" data, and the distribution reporting.
Supply to local distribution companies is only one element of the system operator's "Ontario Demand," which also includes consumption at generators, transmission losses, and supplying large wholesale consumers. About 85% of the IESO's "Ontario Demand" is due to supplying LDC's.
Wholesale consumption at peak has been dropping due to the Industrial Conservation Initiative (ICI), which allows large consumers to save costs throughout the year by reducing consumption at the IESO's peak hours (at the expense of other consumers). Presumably the IESO's wholesale customers are "Class A" consumers benefiting from reducing their demand during system peak demands. Analysis of wholesale data shows that demand has indeed fallen at annual summer peaks since the ICI was introduced for the summer of 2011. Prior to the program wholesale consumption during the summer peak was similar to the annual average consumption, but with the introduction of the ICI program annual minimums in wholesale consumption became inversely related to the summer peaks for "Ontario Demand."
While lower wholesale consumption at the IESO during peaks would shrink the difference between its peak and the peak for local distribution companies, it can't drive LDC peaks higher, and in recent years the same ICI program lowering wholesale demand at peak would also be lowering demand from LDC's during peaks - because the majority of participants in the ICI program are now embedded in local distribution territories.
While the ICI may explain some of the change in the relationship between LDC peaks and IESO (grid) peaks, the bigger change is the growth of distributed generation. Since 2005 over 3,400 MW of generating capacity has entered commercial operation embedded within local distribution networks, with 63% of that capacity being solar. Embedded generation impacts the IESO by reducing demand for supply from the IESO-controlled grid (which is what the IESO calls "Ontario Demand"). This has pushed "Ontario Demand" peaks from mid-afternoon to later hours.
Most Local Distribution Companies (LDCs) are reporting on metered consumer consumption and - surprise! - actual consumption peaks haven't been falling as quickly as the IESO data indicates. I suspect they've been perceived as falling at the IESO because, as I tried to communicate in criticizing their Annual Planning Outlook, the IESO hasn't communicated it has a good understanding of solar data.
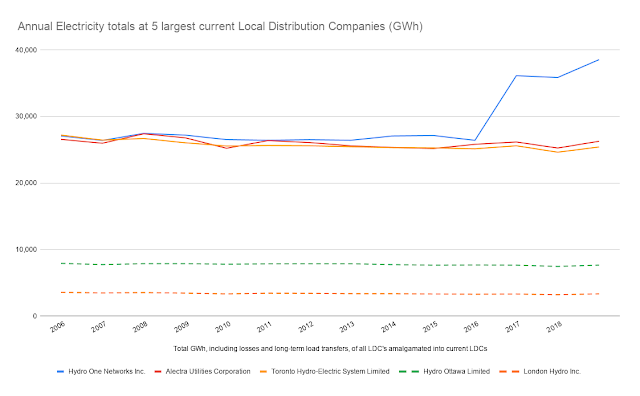
The data the OEB publishes on LDCs in not consistent. Data for the most recent years (2016-2018) is problematic as Hydro One Inc. suddenly included the electricity delivered to the IESO's wholesale consumers via Hydro One's distribution system. This inconsistency is particularly clear comparing data from the IESO's Reliability Outlooks to the totals for LDCs in the OEB's Annual Yearbooks. Prior to 2016 the Yearbook totals are very close to the sum of the IESO's totals for LDC consumption, losses, and embedded generation. As of 2016 the LDC consumption moves sharply higher as it contains much of what the IESO reports, separately, as Wholesale Consumption.
I found the increase in the LDC consumption reported for the past 3 years was due to changes in the reporting.
There is the question of what the OEB Yearbook reporting is for. It seems to me a lot of reporting is because people are in a job that requires the production of the reporting - which is fine, but seems like it shouldn't be the exclusive reason. I don't look at the reports themselves, but attempt to extract data in the tabs of the accompanying spreadsheets containing detailed data for individual LDCs. Only by looking at LDC's is it easy to spot the problem (a.k.a. Hydro One). I've tracked consolidation and queried the data by current LDC (including former LDCs they contain). Here is a summary view of annual summer peaks at the 5 largest distribution companies:
The view of annual electricity at the top 5 looks similar, but there are a couple of notable differences: Hydro One doesn't have the 2014 spike (likely indicating an issue), and it's notable that Alectra's annual totals are similar to Toronto Hydro's despite its summer peaks being consistently higher.
Searching through summary pages of the 2016 Yearbook does lead to a note on the "Total Electricity Delivered" metric that varies greatly from previous reporting for 2012-2015. A footnote explains:
This metric represents the total kWh of electricity delivered to all customers in the distributor's licensed service area and to any embedded distributors. Past figures have been updated to reflect distributor data revisions.I think there needs to be some reflection on what the data should represent, and what hierarchy structure is needed to allow that. It's not desirable to double count electricity delivered to one LDC through another, and it's not desirable to claim some elements of wholesale consumer consumption delivered via the LDC, and no other wholesale consumption metrics.
Past figures for base data at the LDC detail level had not been updated - just the "snapshot" page. For most LDC's the data history found in the Ontario Energy Board's Electricity Utility Yearbooks is useful. Because of one LDC that isn't true of all summary sections.
google sheet
excel workbook


96F28F6CEE
ReplyDeletehacker bul
hacker arıyorum
tütün dünyası
hacker bulma
hacker kirala
119BCF10A4
ReplyDeletetiktok takipçi satın al
green swivel accent chair
1E3B15DFE8
ReplyDeletesteroid fiyatları
whatsapp güvenilir show
steroid satın al