
Bruce Sharp, an energy analyst I greatly admire, recently produced Ontario Electricity - the Cost of Coal Replacement, which put some numbers up against an Ontario government document on The End of Coal. That document is not the proper starting point for evaluating the cost of ending coal, but Sharp's methodology for pricing provides a useful foundation to build an analysis upon.
 |
| table from Bruce Sharp's Ontario Electricity - the Cost of Coal Replacement |
4,000 megawatts of wind, and 1,500 of solar, were not part of the plan to replace coal. I've previously demonstrated added natural gas and nuclear generators compensated for the removal of the coal-fired power plants.
.png) |
| Graphic from January 2013 post - data in this spreadsheet |
...Under the coal replacement plan:
- Thunder Bay GS, representing 310 megawatts, will be replaced by gas- fired generation in 2007.
- Atikokan GS, representing 215 megawatts, will close by the end of 2007...with no direct replacement necessary.
- Lambton GS, representing 1,975 megawatts, will be replaced by the end of 2007 by two combined-cycle gas-fired generating stations...
...To support the replacement of coal-fired generation in Ontario, the McGuinty government has put the wheels in motion to produce well-over 7,500 megawatts of cleaner, more diversified power...The government is also currently reviewing a tentative deal with Bruce Power for the refurbishment of two laid-up nuclear reactors, which together represent more than 1,500 megawatts of additional capacity. If concluded, this agreement would raise the total of McGuinty government initiatives to 9,145 megawatts.
- The government has put the wheels in motion on over 5,000 megawatts of diversified generating capacity that will support the closure of Nanticoke. Initiatives include: industrial co-generation, new generation in downtown Toronto, new demand management and demand response initiatives, new generation in the west GTA, the Niagara Tunnel project, the refurbishment of Pickering A unit 1 and RFPs for 1,595 megawatts of renewable energy.
...In creating new capacity, the government has placed particular emphasis on expanding renewable generation in the province, and is well on its way to meeting its target of adding five per cent, or 1,350 megawatts of new renewable generating capacity by 2007.The quoted sections sketch out plans for all coal-fired generating stations operating at the time, but the references to "renewable" capacity are for capacity of 1350-1500 megawatts (MW). The details of the plan changed a little, but this is basically the plan implemented. I've identified over 8900 MW of supply [1], by generator, matching up to this plan, including a 289 MW Mississauga gas plant not yet operating, and no longer in Mississauga.
Querying my database for the generators that did replace coal, I find over the past 3 years they have averaged about 25 terrawatt-hours of supply (coal produced about 30 TWh in 2005) at an annual cost of around $2.6 billion. From this total I might subtract $1.25 billion, estimating 25TWh of coal at $50/MWh - which was the price below which the operator, OPG, required contingency/capacity payments to keep the plants operating.
$1.35 billion is a base estimate from this methodology, to which some other charges still need to be added from the plan - including transmission costs and the cost of the Niagara tunnel project.
Actual figures from recent years may not be fair in evaluating the policy and execution as there's been a demand-reducing recession, a lot of other generation added, a large amount of spending on conservation programs, and it's wrong to assume the 25TWh of generation today comes in the timely manner coal-fired generation once did.
Because there are so many other variables acting on electricity supply over the past decade, modelling could provide a better estimate of the cost of Ontario's actions to exit coal. My alternate method returns to Bruce Sharp's framework and makes some fresh assumptions in revising it to produce an estimate for only the generation added to replace coal-fired generators. My assumptions, in addition to those noted in Sharp's table displayed above, are:
- coal operated as an intermittent generator, so nuclear generation replacing coal I limit to coal's 2005 capacity factor (53%)
- wind is limited to the share of production matching coal's capacity factor (only 54% of the output replaces coal)
- Coal Generators are assumed to have had net revenue requirements half the level of the those provided the new natural gas generators ($410 million/MW per year)
- Biomass capacity at Thunder Bay and Atikokan treated as new natural gas generators
- generation that has no coal to displace is dumped/sold at $10/MWh

This methodology gives me a similar result to the earlier one; generators that displaced coal in Ontario directly add about $1.4 billion a year to costs - with 140 terawatt-hours currently consumed annually, that's a neat 1 cent/kWh ($10 per megawatt-hour). These are not the only costs of getting off coal. Two other significant spends:
- Transmission work was specifically part of the plan. I estimate very roughly that $1.5 billion was spent [2]
- The Niagara tunnel work was also part of the plan. Again $1.5 billion. There's been no discernible benefit that I've noticed, but the spending is now in the rate base.
An annual figure to attach to this $3 billion is roughly $420 million (14% annually) - putting the price of the coal exit plan closer to $1.83 billion.
The "Implied Carbon Cost" should be considered as covering much more than CO2. The reduction of CO2 was not the primary selling point of eliminating coal-fired generation. Health concerns were. [3] The coal-fired replacement plan I've based this analysis on was titled McGuinty Government Unveils Bold Plan To Clean Up Ontario's Air, and the subtitle was "Replacing Coal-Fired Generation Means Cleaner Air And Better Health For Ontarians." It contained:
A cost benefit analysis released in April uncovered massive health and environmental costs from coal-fired generation. The study found emissions from all coal-fired stations were responsible for up to 668 premature deaths, 928 hospital admissions and 1,100 emergency room visits in Ontario per year. It also found that with an annual cost of $4.4 billion, coal-fired generation is significantly more expensive than other sources of electricity.The study that produced the $4.4 billion figure included a "Nuclear/Gas" scenario where those sources replaced coal. That scenario was supposed to have a $544 million higher "Financial Cost" than the base (coal) case, but health impacts were to be $2.655 billion less, with an additional $323 million in reduced environmental damage.
 |
| from Cost Benefit Analysis: Replacing Ontario’s Coal-Fired Electricity Generation |
Returning to the cost of generation, my $1.4 billion is not lower than Sharp's $2.69 billion because Ontarians haven't spent $2.69 billion (or more), but I've displayed that the spending was not on the limited set of generators specifically planned to replace coal generators. The big difference between Bruce's calculations and mine is I did not consider most wind, and no solar, as part of the effort to eliminate coal. One thing that strikes me in the DSS study is the Health Damages of the "All Gas" scenario is not much different than those costs in the "Nuclear/Gas" scenario. It is valid to view implied carbon costs of $67-$87/tCO2e when there is considered additional, and to the sellers of the coal phase out, more important health concerns. However, if the implied carbon cost is considered a proxy for all things bad, it is not valid to allow it to be higher for displacing natural gas generation than it is for coal - it should be far lower.
I've run numbers, as for the coal phase-out, for the wind and solar generation that exists today in Ontario (excluding the 1,514 MW of wind I considered belonging to the coal phase-out). The rules aren't different from the previous analysis, but after the coal phase-out the capacity factor of natural gas (and biomass) capacity is modeled at 41%, and obviously the displacement is of 0.4 metric tons of carbon dioxide equivalence, not the 0.93 tCO2e of coal.
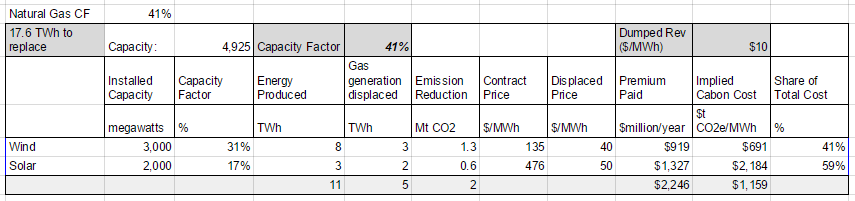
The implied carbon cost of the renewables procured after the contracting of supply to displace coal is estimated at $1,159 per ton of CO2 equivalent.
The annual cost is $2.25 billion, but this is also incomplete - both distribution and transmission networks needed capital spending to allow this capacity to be constructed. While this translate to 1.6 cents/kWh base on 140 TWh consumption, the costs are not spread evenly across all consumers, and cost shifting doubled the impact on the typical Ontario consumer in 2015.
There is no health study that makes the wind and solar procurement that followed the coal phase-out work appear competent. It has impacted Ontario ratepayers to a far greater extent than the decision to phase-out coal.
Jurisdictions looking for an example of the rate impact from eliminating coal-fired generation should not look to recent rate increases in Ontario as a guide - but those looking to increase wind and solar thoughtlessly could.
End-notes
1. The locations are listed in the [Generators] tab of this spreadsheet - as are all numbers I note in this post.
2. Capital spending on transmission clearly accelerated after 2005, and to a much greater extent than spending on distribution.

3. For a perspective far from mine on the coal phase-out, view Phasing Out Coal: Lessons from a Massive Climate Achievement (I do hate the title, but ...)
________
In searching for one thing I'd written previously I discovered I wrote, in 2012, Estimating the Costs of Eliminating Coal-fired generation in Ontario. It's not my best work.
I got better.
Early in January 2013 I wrote Ontario's Decision to Close Coal Plants: Air Quality/Emissions Savings Likely Overstated - which is much better. It included:
The environmental value of phasing out coal would come primarily in setting an example that it could be done economically.
05EE09511F
ReplyDeleteGörüntülü Seks
Sanal Sex
Ücretli Şov