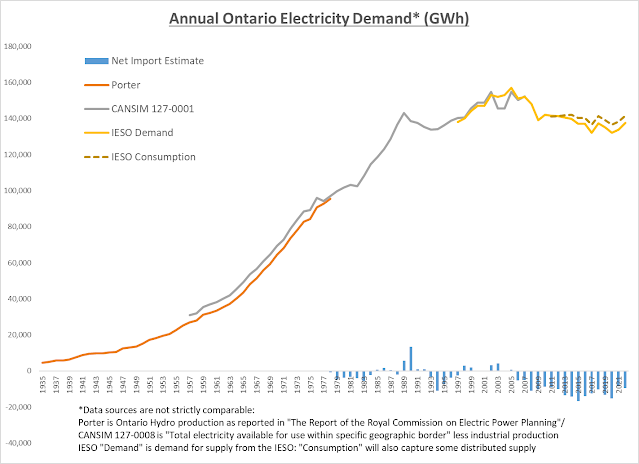
I’ve assembled a long view of annual Ontario Electricity production and/or consumption, from 1935 to 2022. There should be policy implications to take from the data.
Over 12 years ago I published the first article on my first blog: “The Current and Future State of Electricity, as the [Ontario Clean Energy Benefit (OCEB)] comes to Ontario.” I noted in that work that 2010, “[Seemed] like a good time for a big picture overview…” The OCEB was a 10% reduction of bills to, “help consumers manage rising electricity prices for the next five years.” Twelve and half years later the discount has a different name (Ontario Energy Rebate), and is 11.7%. 2023 strikes me a lot like the period running up to the Green Energy Act, so here’s the long view of Ontario’s demand history as information to protect for a repeat of that heist as we renew interest in procuring new sources to meet future provincial demand..The graph of demand for the last 88 years contains 4 data sources, none of which are matched precisely to another:
- “Porter” refers to the chair of 1980’s “The Report of the Royal Commission on Electric Power Planning”, and specifically data contained in appendix A of Volume 2. The figures shown are cited as originating in “Ontario Hydro’s Power Resources Report No. 790201.” In terms of comparison to other data sources in the graph the notable thing about this is that the figures represent production (not demand), and they’re a partial representation of production as there was electricity generated by entities other than Ontario Hydro.
- CANSIM 127-001 is a Statistics Canada monthly dataset built from survey data that existed, at a couple of levels of complexity, from 1957-2007. For purposes of attempting alignment with other data sets, I’ve subtracted from the report’s “Total Available” value the figure shown for “Total Industrial Generation.” Without diving into the exact meaning of the latter field I assume it is self-generated (or behind-the-fence) generation which, while nice to know, is not a component of the other data sets in the chart. It must also be noted “Total Available” includes imports and excludes exports, unlike the “Porter” data
- “IESO Demand” is the figure reported by the Independent Electricity System Operator (IESO) as “Ontario Demand” - by which I understand they mean demand for supply from the IESO-controlled Grid (ICG). This differs from CANSIM 127-001 in a couple of ways: it will not capture generation from generators embedded within local distribution companies’ grids but it is data based on data far more reliable that that collected through surveying
- “IESO Consumption”is a figure from the calculation of global adjustment charges as that proportional chargeback tool (for costs of supply not recovered through market revenue) requires calculating a consumers usage as a share of all consumers’ usage. As confusing as that sounds, this measure essentially differs from Ontario Demand in that it does capture the impact of distributed generators in supplying demand, although it omits the share of generation that is lost in transmission lines (as does the CANSIM 127-001).

