
The main conclusion of the study is that building out the wind industry in Canada does very little to reduce greenhouse gas emissions in Canada.
The study was mostly paid for by Canadian taxpayers via Natural Resources Canada:
"The project’s primary goal was to obtain insight into the challenges, opportunities, mitigation measures and operational tools needed to efficiently integrate wind energy into the grid. This has been accomplished by undertaking an integration study approach, which involves matching time series modelled wind energy production data with electricity demand data, and evaluating how this influences the rest of the electricity grid."I'll evaluate the data work for Ontario, although some claims the study makes for other provinces also demand comment.
The basis of supportable PCWIS statements results from their modelling of generation and demand, which are fed through what they assert to be world class black boxes, named MAPS, MARS and PSLF, to produce important metrics. The description of their determination of capacity value is the most coherent I've seen:
...the study team utilized the Expected Load Carrying Capability (ELCC) method to calculate the capacity value by province, as follows:
- In the absence of wind, the province load was scaled until the province LOLE [Loss of Load Expectation] reached 0.1 days/year
- Wind power was added to the system, which caused the LOLE metric to decrease
- Load was increased until the resulting LOLE reached 0.1 days/year once again
- Wind capacity value is measured as the difference in peak capacity between steps 3 and 1
The ELCC methodology is not often used by system operators due to the technical challenges of modelling energy demand and generator availability, and performance, throughout a year. One exception is the Midwestern Electricity System Operator (MISO). For 2016-2017, MISO evaluated ELCC values for zones adjacent to Saskatchewan, Manitoba and Ontario as 13.8% to 18.8%. The PCWIS base scenario (2025 business as usual, with wind at 5% of annual generation) shows far higher relative capacity factors: 27.4% in Saskatchewan, 37.5% in Manitoba, and 33.1% in Ontario. The figures contrast starkly with a Manitoba Hydro evaluation that, "the capacity value of wind generation within Manitoba to meeting the winter peak load is zero," and the current IESO (Ontario system operator) 18-month outlook expecting just 474 MW from 3,823 MW (12.4%) of wind capacity to meet peak demand.
A significant problem for the PCWIS model is the lazy selection, and collection, of data. Problematically for modelling of load:

The chronological load patterns were based off of historical load data, accessed via ABB Velocity Suite’s Historical Demand by Zone Hourly dataset. In order to maintain weather-linked correlation between historical load and wind profiles the 2008 weather year load profile was scaled up to the annual energy and peak demand targets by the GE MAPS model.2008-2010 is a better base period for future forecasting than 1929-1931, but that might be the only series of 3 less suitable years. The weather significantly affects demand for electricity, but so does a recession. With atypical demand connecting modelled wind is particularly unlikely to capture the relationship of wind and demand, whatever it may be.2 Adjusting demand during an atypical year to the total consumption from a typical year would be both a difficult and entirely unnecessary challenge, even without the growth of solar.
Solar, and all other embedded generation (Dx), has distorted the view electricity markets have of total electricity demands (which are what the PWCIS model uses). Dx generation would have been growing from 2008-2010, although perhaps not so significantly as to corrupt the load modelling significantly. However, the 2025 BAU (business as usual) scenario for Ontario is heavily corrupted by the lack of research into what already exists, what is contracted, and what is planned for 2025.

It's clear to me PCWIS starts with bad load data and gets the business-as-usual (BAU) case entirely wrong.
I ran values for PCWIS scenarios through my calculator (as in my previous post), which tests supply mixes with real data from the past two years as well as a modeled year. Keeping in mind the only variables PCWIS changes from one scenario to another are for wind:
- The 35% wind target meets all the demand at all times, and the NERC reserve margins, but creates an excess of 21.5-24 terawatt-hours (TWh) per year, much of which will need to be curtailed unless transmission intertie capabilities with other markets are increased to 3 times the current capacity.
- The 20% wind (concentrated) scenario met all demands except for one hour, but using the current capability at peak for wind from the IESO, fails to meet NERC reserve margins in the summer.3 Exports/curtailments decrease to 6.2-8.4 TWh, with the need for increased interties to utilize all supply is much smaller.
- The PCWIS 5% BAU scenario (which is not factually BAU), fails to meet demand in 3 hours, but very little excess supply is generated for export or curtailment, and the excess that does exist is easily handled by today's intertie capability.
The PCWIS explains the industry standard in determining capacity values is demand will be met for all but 0.1 days/year (2.4 hours) per year, so all scenarios would be considered acceptable - with the business as usual therefore being the most efficient in meeting demand.
Reliability requirements are met in all scenarios because they are met in the BAU scenario and the only variability that changes in other scenarios is wind capacity is raised. Consequently, my model finds, for Ontario, natural gas generation required to meet demand drops from ~25.5 TWh (a 23% annual capacity factor) in the PCWIS BAU scenario to 11.5-13 TWh (11% CF) in the PCWIS 20% wind concentrated scenario, to 7.2-8.3 TWh (7% CF) in the 35% wind scenario. This means 19.5 TWh of wind added in the 35% scenario displaces only 4-5TWh of natural gas-fired generation in Ontario, and that is in a perfect world with 100% ability to exactly fill demand with gas-fired generation as demanded. The numbers would be far lower in Quebec, Manitoba and British Columbia, where most generation is from hydroelectric sources, so not fuel cost is avoided within the jurisdictions. The conclusion reached in the PCWIS is that emission reductions in the United States will far exceed those in Canada - and that must be correct.
Reliability requirements are met in all scenarios because they are met in the BAU scenario and the only variability that changes in other scenarios is wind capacity is raised. Consequently, my model finds, for Ontario, natural gas generation required to meet demand drops from ~25.5 TWh (a 23% annual capacity factor) in the PCWIS BAU scenario to 11.5-13 TWh (11% CF) in the PCWIS 20% wind concentrated scenario, to 7.2-8.3 TWh (7% CF) in the 35% wind scenario. This means 19.5 TWh of wind added in the 35% scenario displaces only 4-5TWh of natural gas-fired generation in Ontario, and that is in a perfect world with 100% ability to exactly fill demand with gas-fired generation as demanded. The numbers would be far lower in Quebec, Manitoba and British Columbia, where most generation is from hydroelectric sources, so not fuel cost is avoided within the jurisdictions. The conclusion reached in the PCWIS is that emission reductions in the United States will far exceed those in Canada - and that must be correct.
Decreased utilization of power plants is not a factor the PCWIS costs. Few economic factors are.
While their base data work is poor, and I suspect their capacity factors exaggerated because of it, their economic work seems intentionally deceptive, allowing the industry lobby group, CanWEA, to claim, "Canada can integrate large amounts of wind energy reliably, cost-effectively, says report."
Limited Focus of the Economic AnalysisWhat the analysis did include is indeed "limited" - and biased:
The study scope did not include evaluation of the economic viability of the generation resources that would be significantly impacted by the higher penetration of wind and their downward pressure on electricity costs caused by displacement of fossil fuel based generation.
... production cost simulations quantify variable operating costs only. These are the costs that determine which units, of the ones available to the system operator, should be utilized to serve load in a least cost manner. These costs include generating costs associated with fuel consumption, variable operations and maintenance, emissions, and unit startup. The production cost analysis does not include costs related to new capital expenditures required for new wind additions or fixed operations and maintenance.
Free industrial wind turbines!
The writers of PCWIS quantify the free wind turbine methodology as:
𝑷𝒓𝒐𝒅𝒖𝒄𝒕𝒊𝒐𝒏 𝑪𝒐𝒔𝒕 = 𝑭𝒖𝒆𝒍 𝑪𝒐𝒔𝒕 + [Variable Operations and Maintenance] 𝑪𝒐𝒔𝒕 + 𝑬𝒎𝒊𝒔𝒔𝒊𝒐𝒏𝒔 𝑪𝒐𝒔𝒕 + 𝑺𝒕𝒂𝒓𝒕𝒖𝒑 𝑪𝒐𝒔𝒕 4 ...the production costs need to be adjusted by accounting for the export revenues and import costs (or for short “net export revenue”). Hence, the appropriate metric to be employed is the Adjusted Production Cost, defined as: 𝑨𝒅𝒋𝒖𝒔𝒕𝒆𝒅 𝑷𝒓𝒐𝒅𝒖𝒄𝒕𝒊𝒐𝒏 𝑪𝒐𝒔𝒕 = 𝑷𝒓𝒐𝒅𝒖𝒄𝒕𝒊𝒐𝒏 𝑪𝒐𝒔𝒕 − 𝑵𝒆𝒕 𝑬𝒙𝒑𝒐𝒓𝒕 𝑹𝒆𝒗𝒆𝒏𝒖𝒆
This limited quantification methodology allows for crazy to be graphed - the more turbines are added, the less they are utilized, while value just gets better and better until all are free - and better:

The PCWIS communicates that the cost of natural gas generally sets electricity pricing on markets. Although gas is often the fuel of the marginal generation, price generally is determined by scarcity - if one location has far too much generation, their neighbours need not give them the cost of avoided fuel to take it off their grids, and in Ontario the opposite has been demonstrably true: surplus electricity has been worth little, or nothing. 5
There are a number of other criticisms that could be made on the economic modelling, but I believe the disinterest in pricing the cost of the generators themselves coupled with the disinterest in properly discounting the price of excess generation demonstrate there's been no sincere attempt in the PCWIS study to actually price any supply mix scenarios.
Natural Resources Canada described a purpose of the study was "to obtain insight into the challenges, opportunities, mitigation measures and operational tools needed to efficiently integrate wind energy into the grid." This is difficult for anybody to evaluate, but as an observer of Ontario's energy system I'll offer up some contrasts in the current situation in Ontario and the happy situation found in the PCWIS work.
In Ontario wind forecasting has been cited by a market review panel as the cause of almost all price spikes during the last reporting period; the system operator (IESO) consequently sent out requests for Information for regulation service and launched a new consultation initiative on Enabling System Flexibility.
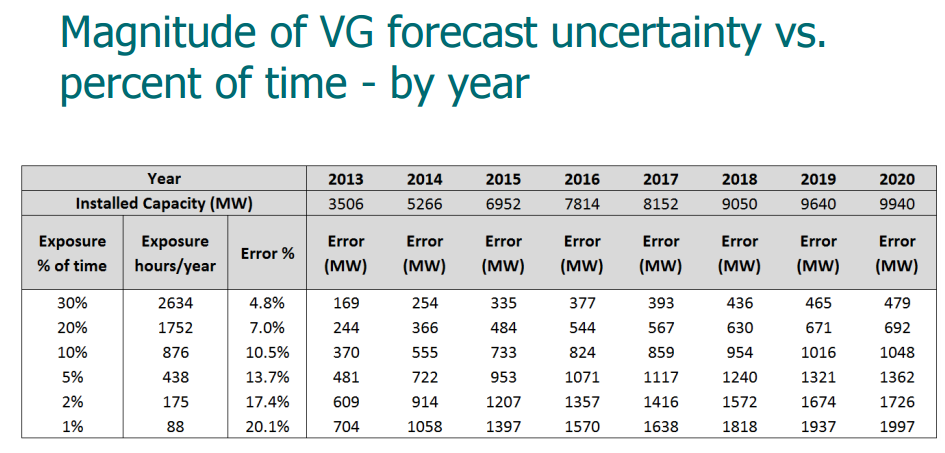 |
| from slide 17 of IESO presentation on Enabling System Flexibility |
Conversely, the PCWIS finds very little needs to be done: they show no more than a 197 MW increase in "Regulation MW" under any scenario. The ISO's figures seem to be for 1-hour out forecast, whereas the PCWIS is based on their statistical analysis built on unusual consumption years with the wrong supply mix fed into the model.
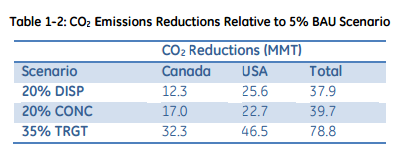
An illustration from the report demonstrates new industrial wind installations required to achieve the 20% wind (concentrated) scenarios which is claimed with reduce Canadian CO2 emissions by 17 million metric tonnes (MMT).

Alternatively, approximately 1 new power generation site could accomplish the same reduction in Canada. Just dust off the Bruce Power proposal from 2008 and bump coal in Alberta and Saskatchewan by adding nuclear power.
Ontario's 3000 megawatt capacity Pickering Nuclear Generating Station produces, on average, about 2300 megawatts each hour in recent years. Over the past 36 months, Ontario's exports to Michigan averaged over 1000 megawatts each hour. By PCWIS logic this would be massively positive, both monetarily and for emissions; as Michigan, and it's neighbors Ohio and Indiana, still get much of their generation from coal. Replacing just 1/2 of Pickering's capacity, currently slated to exit service by 2024, would provide a 10-15 MMT CO2 emissions reduction measured against the PCWIS BAU scenario - but only if exported to coal powered jurisdictions.
Bruce Power was pursuing the possibility of reactors in Saskatchewan 8 years ago, but Albertan disinterest combined with Saskatchewan's reasonable concerns about the impact of a generator greater than 300 megawatts on their grid combined to kill the idea.
Bruce Power was pursuing the possibility of reactors in Saskatchewan 8 years ago, but Albertan disinterest combined with Saskatchewan's reasonable concerns about the impact of a generator greater than 300 megawatts on their grid combined to kill the idea.
Environmentally, the best result for Canada would be the success of a company producing smaller nuclear units that could replace coal-fired generation units on the same generating sites. Just six 300 megawatt capacity units could avoid all the red dots in the scenario pictured in the PCWIS scenario above, where each dot corresponds to more transmission towers, wires, several man-made structures taller than most skyscrapers, and absolutely ridiculous claims from tax-payer funded, lobbyist provided, studies.
End-notes
1. Available from the "Downloadable Report Sections" links at http://canwea.ca/wind-energy/wind-integration-study/2. From the PCWIS summary:
Wind speed and meteorological data were provided by Environment and Climate Change Canada and were the basis for developing wind power profiles for both existing and future wind plants in Canada. This wind data set included 54,846 individual 2km square grid cells at 10-minute time intervals for 3 calendar years (2008 to 2010). Vaisala processed the grid-cell wind speed data into power output profiles by applying composite wind turbine power curves and also accounting for the effects of dynamic turbulence/wake losses, icing effects due to temperature and humidity1, and turbine low-temperature cut-off2. EnerNex aggregated the grid-cells into a large number of wind plants across all Canadian provinces, ranging from 16 megawatts (MW) to 448 MW in capacity. GE then selected appropriate combinations of these wind plants to create the required simulation models for each of the study scenarios.
3. My reading of the PCWIS is that it claims NERC reliability/reserve requirements are met in it's scenarios using capacity values provided by system operators. For Ontario the operator is the IESO, and given the maximum demand PCWIS models expect in each of their 3 model years, the PCWIS claim strikes me as very unlikely.
4. To my knowledge over the decades Canadian entities have been exporting electricity south there has never been a payment to recognize the low carbon emissions of the exported power - but there's long been a hope low emissions power will be monetarily rewarded.
.png)
5. I try to demonstrate this with Ontario data in What Goes Up is your price - as wind blows market rates down, but it's very complicated when I communicate it.
Far simpler, perhaps, is the lucid Lion Hirth's work including The Market Value of Variable Renewables: The Effect of Solar and Wind Power Variability on their Relative Price
Here's how to cut your electric bill up to 75%:
ReplyDeleteWant to know how to easily produce all of the green energy you could ever want right at home?
And you’ll be able to make your home totally immune from power failures, blackouts, and energy grid outages…
so even if everyone else in your area (or even the whole country) loses power…you won’t.
HERE'S HOW: DIY HOME ENERGY
ReplyDeleteWhen considering various printing options, many professionals turn to dtf transfer sheets for their durability and vibrant results. These sheets provide an efficient solution for transferring designs onto different surfaces, making the process both straightforward and reliable. For those wanting high-quality prints, exploring the benefits of dtf transfer sheets can be a game-changer. Ultimately, they are a preferred choice among artists and manufacturers alike.