Pages

Saturday, February 19, 2022

Ontario Electricity Exports: losses, benefits, and transmission charges

In 2021 Ontario’s electricity market sold exported electricity for $1.25 billion dollars less than Ontarians paid to have it supplied. That amount is calculated with a methodology I described one year ago. 2021’s $1.25 billion loss is an improvement on 5 of the past 6 years, and $563 million better than we fared in 2020.

Others look at exports differently. Today we visit the murky world of the Ontario Energy Board (OEB) as it deals with a transmission charge for exports - which is where we find the IESO providing expert opinion.

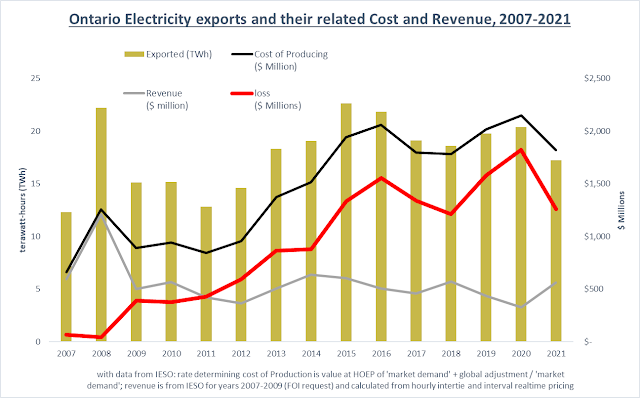
A quick review of my work estimating losses on exports for those who haven’t memorized last year’s article: I copied (or attempted to) the methodology of the Office of the Auditor General in its 2015 annual report, which tallied up total system cost and usage to find an average cost of supply, takes revenues and volumes of exports, and does the math on how much lower the overall cost of exports was at the rate exporters paid than if they’d paid the average rate.

If I had to present a one-sentence hit on that I’d borrow from professionals on the wording and put in my calculated figures:

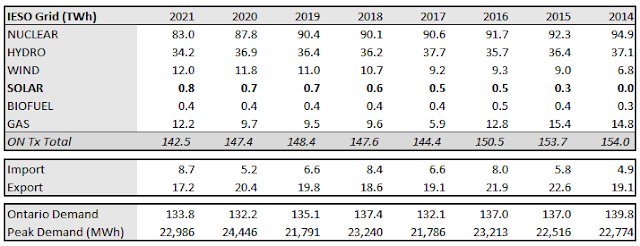
exports of electricity from Ontario have contributed between $1.2 and $1.8 billion of costs annually to Ontario’s Global Adjustment Charges between 2017 and 2020

Sunday, February 13, 2022

2021 Ontario Electricity Data Summary and discussion

Ontario’s system operator (IESO) was tardy in publishing its “year in review” summary - and I was content to delay mine until their’s appeared. Before diving into the analysis I want to note the some challenges facing the sector as they’ve emerged in my media world:
  • the role of electricity in the broader energy sector;
  • the role of natural gas in the electricity sector;
  • decarbonization;
  • the role of Quebec supply in Ontario’s electricity mix;
  • the role of pricing to encourage electrification of transportation;
  • the role of nuclear and desirability of refurbishing Pickering B,
  • the role of storage,
  • the future supply mix,
  • pricing policies to shift consumption to periods of excess supply.
An annual analysis provides metrics that have utility, but it should be kept in mind this summary level of analysis has limitations. I’ll summarize annual statistics for not only 2021 but also for the years from 2014-2020 to give a perspective on where we were as well as where we are.

If you follow me on Twitter you may have seen the first numbers in the IESO’s summary, albeit in different units, days before the IESO posted them. Whereas the IESO posts these separately I’ll show the past 8 years here: