
A solar panel added to Ontario, today, has a capacity value of less than 6% and the reality is if solar continues to be added peak requirement for new supply will move to winter evenings and instead of new solar’s capacity value being close to nothing it will be absolutely zero.I wrote that yesterday and, inspired by an exchange on Facebook, want to support the statement, add industrial wind to it, and argue the relevance of the statement not only to Ontario, but in California where the claim is a nuclear power plant can be closed and the output replaced with negawatts/efficiency/conservation, solar and wind.
Electricity supply is of value to a system in multiple ways. The two I examine are basically the actual watt-hours of output (I'll call this "energy value", and the ability to produce the output when demand calls for it (this I will call the "capacity value").
The diminishing value energy value of intermittent generation should not be well known. I was excited to write on the decrease three years ago, but a current work from Lion Hirth (and Simon Müller) explains well why now seems obvious:
In hours of high wind speeds, the additional supply of electricity from wind turbines depresses the price below the level it would otherwise have been. This price drop is greater, of course, when larger amounts of wind power are installed, a phenomenon that has been described as the “self cannibalization effect” (a dramatic term for the simple consequence of increased supply). As a consequence, the market value of wind power declines with its market share.This post will deal only with "capacity value".
Additional solar, and wind supply, have lower capacity value today because the operator of Ontario's electricity system, the IESO, released an updated outlook showing the capacity of solar panels connected to the IESO's system grew by 240 megawatts (MW) over the past 12 months, but the IESO expected only 14 MW of production from that capacity during the peak demand for generation. Dividing 14 by 240 gives a measurement for the capacity value, of 6%.
Less notably, but likewise moving lower, industrial wind turbine capacity increased 898 MW, with only 105 MW more output expected at peak demand. That's a capacity value of 10.4%, and as with solar, it's worth stressing those are the IESO's numbers, not mine. I'll address whether those figures are valid in a future post.
The reason for the decline is the expected hour of peak demand has moved later in a summer's day. The reason for the move is not a changing consumption patterns, but changes in the electricity supply mix. While this doesn't change the valuation story, it does require some explanation.
The IESO’s use of the term “Ontario Demand” to describe the need for generation from one type of supplier - those connected directly to their system (Tx) - is a big source of confusion. Elsewhere [1] they use the term "Energy Demand" for the exact same number, and show it comprised of LDC (Local distribution company), Wholesale, and Generator consumption as well as Losses.
The IESO’s use of the term “Ontario Demand” to describe the need for generation from one type of supplier - those connected directly to their system (Tx) - is a big source of confusion. Elsewhere [1] they use the term "Energy Demand" for the exact same number, and show it comprised of LDC (Local distribution company), Wholesale, and Generator consumption as well as Losses.
Generators connected within LDC distribution grids (Dx) have official hourly reporting available for only 5 hours each 12 months - the five coincident peak hours of May 1-April 30 base periods (Hi5) for the Class A global adjustment scheme. The Hi5 are based on daily peaks of yet another measurement, the Allocated Quantity of Energy Withdrawn (AQEW), which I understand to essentially be the wholesale and LDC consumption components of "Ontario Demand".
Looking at average Hi5 values for each of the 6 completed base periods, demand has dropped significantly (which may just indicate 2 consecutive mild summers), but the "Total (MW)" shown by the IESO (AQEW plus "Embedded Generation") , which I've termed consumption, has declined far less.

While the embedded generation has clearly grown from the extremely limited data set provided by the IESO's reporting, the extent of the growth is disguised as the hours have been pushed back. During the first adjustment period 4 of the hi5 hours were in hour 16 (4 to 5 pm in the summer), and the other in hour 15. Only 2 of the 10 hi5 hours in the most recent adjustment periods occurred before 5 pm (hour 17). Consequently, the embedded average is comparing later hours in recent years to afternoon hours in 2010-2011.
I estimate embedded generation for all hours, and consumption. Looking at only the peak consumption value of each calendar year, the hi5 hour hasn't matched my expected peak since 2011 - and the actual peak consumption hours are much earlier in the afternoon, unless a year has a particularly cold winter and unusually mild summer, as in 2014.
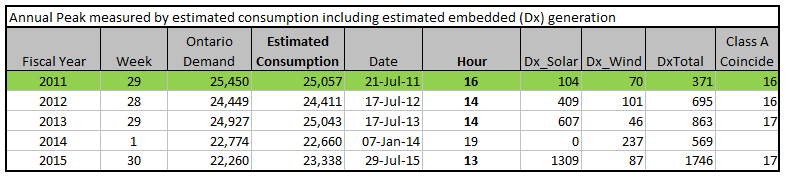
I've produced a daily report for July 29, 2015 - the final date in this comparison.[2] My estimates of embedded generation do vary from the IESO's reporting on the hi5, but not all that significantly: I estimated 1,108 MW during hour 17 while the IESO reported1,029. The following graphic is revised to illustrate the embedded generation, which I estimated at 1,747 MW in hour 13, pushing my estimate of Ontario's consumption in hour 13 427 MW above the hour 17 consumption - so while not a huge disparity, not particularly close.

The capacity value of new solar is lower because solar is producing more in the afternoon, pushing the need for power later in the day. Wind, during the weeks of normal peak demand (later July), also tends to produce less in the early evening - so we also see it's capacity value dropping in the IESO's work.
Graphing hourly average wind and solar generation (including estimated embedded and curtailed generation), during the later weeks of July, demonstrates the quickly dropping capacity value of solar as the hour gets later each day, and also the decline in wind output that is common after mid-afternoon:

The message that can be taken from Ontario's experience is that the capacity value changes for a type of generation as its market share grows - not only the energy value. Not all electricity markets price capacity and energy separately, but the cost elements need to be addressed regardless of whether they are priced separately, or integrated.
The message some take as solar installations flood a market is that baseload generators must not exist - only generators that can idle when it is sunny, or windy, and ramp up as that changes. But this does not change the capacity value of solar, which is set by the difference between peak demand during daylight hours and peak demand during hours of darkness.
/cdn0.vox-cdn.com/uploads/chorus_asset/file/6296187/kqed-ca-excess-solar.png)
An example of this can be found in California, where Diablo Canyon, the state's last nuclear power plant, is now slated to close to make way for more renewables and "efficiency." The announcement reminded me of a David Roberts column from April, California has too much solar power. It needs another grid to share with. That column used March 27, 2016, as an example of so much solar renewable supply had to be curtailed.
The graphic shows that more solar can be utilized if nuclear disappears, but it also shows at the 8 pm peak solar will be contributing nothing. In this sense not only will 2200 MW of solar not replace Diablo Canyon's output, neither would 2200 GW - California will still need to find supply to replace the nuclear output during many hours each year.
The change in capacity values has very important implications for electricity systems. Incremental additions of a a type of supply after the source has grown beyond holding a capacity value still produces output with an energy value, but it would be appropriate to think of that energy as fuel. Either the energy only generator will have production that pushes aside the fuel from other generating sources[4], such as coal or gas-fired units, or it may be converted/stored. There is excitement from supporters of generation lacking capacity value about batteries, and other storage devices, but there is little understanding that the battery/storage devices are the generators with the capacity value, and solar only one possible fuel to supply them - other fuels could be nuclear generators or expensive coal and gas power plants fitted with carbon-capture technology.
In this post I used IESO figures for anticipated output during the peak demand for supply from IESO generators to define capacity value. While accepting that position was useful in demonstrating the variability of solar's capacity value, the IESO methodology does not produce meaningful capacity values for generation from industrial wind turbines.
I'll consider the capacity value of wind, and the implications for electricity system planning, in a future post.
End-notes
[2] I wrote a quick tumblr post on messages from the hi5 hours when they were posted for the last base period, Transparency about the declining relevance of the IESO’s reporting.
[3] I pulled the sites comprising the hour 17 curtailed estimate from my database. One nuclear reactor looked straight-forward, as did the K2 wind generator located in the same zone (Tx). It is possible the wind dropped in Ontario's west zone, but it's more likely the zone was curtailed, as it increasing is.

I wrote on wind estimation in Ontario's curtailed wind energy - and noted yesterday my monthly totals now look closely matched to the IESO's graphical reporting.
[4] The Ontario Society of Professional Engineers (OSPE) has used the term "displacement sources", and claimed, "The total value of displacement sources to the consumer is only
the economic value of the displaced fuel."
393F21BF27
ReplyDeletesteroid al
Telegram Görüntülü Show Grupları
steroid fiyatları