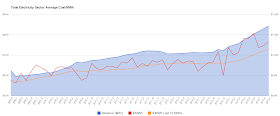
2013's September will have a weighted average Hourly Ontario Energy Price of about ~$22.24/MWh (down 15% from 2012's), and the 2nd estimate for the global adjustment (GA) is $63.08 (up 32% from 2012's $47.62); combined the rate is $85.32, which is ~40 cents above the YTD average, both of which are 16% increases over 2012.
A month ago I was noting the quality of global adjustment estimates, including a first estimate for September of over $87/MWh (sensationally misreported in The Toronto Star days later). The second estimate is 28% lower than the first - and the HOEP plus the 2nd estimate GA combined is also lower than the 1st estimate of the GA.
Emphasizing how scary the global adjustment charges look, the far better than initially feared total dollar estimate for the month is $666 million (actually $666.7, presumably rounded from $666,666,666.66)
I have updated the numbers on my data site estimating supply costs, as well as the monthly preliminary report. In the past these shadow reports have attempted to match IESO reporting figures; this is increasingly unsatisfactory as the IESO's figures are not capturing some fundamental changes in Ontario's electricity sector. For instance, the IESO's "Ontario Demand" is actually a total of supply on the IESO's grid, but currently all solar generation and likely a significant amount of wind generation is not captured in the reporting. Wind and solar are among the so-called embedded generators which only appear to the IESO as a decrease in demand.
September 2013 shows a 2% drop in demand, but over half of this is, I estimate, due to increased embedded generation (the YTD comps are similar). The reports I've provided up to now try to match up to reporting on supply and demand that actually reports neither.
We also get very little reporting on curtailment of generation.
Here's some claims I think are plausible:
- solar generation in September was at a level similar to coal-fired generation
- curtailed suplly (mostly steam bypass at Bruce Power's nuclear units) totalled almost as much as industrial wind turbines generated
The September figures are the first since March that align with my estimates, which could mean my estimates are lousy, but hopefully means there is an end to the mysterious charges the government has indicated ratepayers have been getting hit with for the Oakville Generating Station to be moved well away from Oakville.
Or ... the government may have directed a no-longer professional civil service to manipulate the wholesale rates to equate with the regulated price plan rates most residential consumers pay.
-----
.png) |
| Generation growth from nuclear and hydro (graph from my preliminary monthly reporting page, where it is interactive) |
The average hourly natural gas-fired generation for September 2013 is the lowest I've encountered (since 2009). I've written on how this drives up pricing, but here is an illustration of what it should be driving down:
.png) |
| graph from my preliminary monthly reporting page, |
 |
| Based on graph from my Supply Cost Page: September falls into the trend - which is steeply higher pricing |

No comments:
Post a Comment