I received an e-mail today from a concerned reader wondering at the lack of new posts.
I wish I'd been simply doing other things, but I have been doing the back-end data collection to further my arguments regarding Ontario's electricity system challenges/follies.
I noted a study that came out in the UK recently; “The Impact of Import Dependency and Wind Generation on UK Gas Demand and Security of Supply to 2025,” from The Oxford Institute for Energy Studies.
Chapter 6 of that study, "Wind Intermittency," was not only informative, it included a number of helpful graphs that I felt I would be capable of assembling, with Ontario data, to communicate a similar message in the context of Ontario.
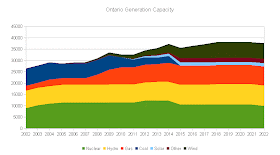
The data base for much of the forecasting work is now built. I shared generation capacity figures in an earlier article showing why wind cannot replace our coal capacity, specifically during July. My assumptions, added to my understanding of the supply mix directive handed down to the Ontario Power Authority (OPA), to be used in producing an Integrated Power System Plan (IPSP), results in a supply mix that looks like this:
 My understanding of Ontario Demand, which isn't dissimilar to the OPA's, is that is it unlikely to increase to 2005's high - and maybe not to the level of 2002 either. If you think about all the debating on the expense of new generation, it's rather striking that generation capacity continues to increase while demand has stagnated. Look at the graph without any wind generation, and you see supply capacity remains above the level that serviced 2005's peak.
Looking at the past, and planned future, wind production, it is easy to see why. I developed the next graph (inspired by the Figure 36 on page 63 of the document from Oxford). For the forecasting, I used the most recent 365 days available, along with the annual wind generation figures I've illustrated in the last graph. Averages were not used despite wind data being available from 2006 on, because it is average for wind to disappear one day and reappear again in varying strengths. The IWT's functioning over the past 365 days operate from the Sault Ste. Marie area to Wolfe Island. The geographic disbursement doesn't help much.
It is apparent that wind will deliver over 6000MW within days of delivering less than 400MW. I'd conclude it is always extra supply capacity within a supply mix ready to meet demand. There is an argument made that wind output is only $X/MWh, on a levelized unit energy cost (LUEC) basis. The specific amount doesn't matter because it is, by itself, irrelevant. The relevant figure is what it costs the system as a whole.
In a future post I'll examine the supply mix and estimate the costs associated with producing more electricity than Ontario consumes.
Notes:
The graphs shown here are from data held in a spreadsheet here. Also in that location is a zip folder containing an MS Access 2007 database file containing, without any guarantee of accuracy, data I've collected from hourly reporting, and/or freely available data off of the IESO website.


Howdy just wanted to give you a quick heads up. The words in your content seem to be running
ReplyDeleteoff the screen in Opera. I'm not sure if this is a format issue or something to do with internet browser compatibility but I thought I'd post to let you know.
The design and style look great though! Hope you get the issue fixed
soon. Many thanks
My blog post - Raspberry Ketone
This paragraph will assist the internet viewers for building
ReplyDeleteup new weblog or even a weblog from start to end.
My homepage :: flight Simulation
Do you have any video of that? I'd want to find out some additional information.
ReplyDeleteVisit my site; Buy Pure Raspberry ketone
Vitamin C full sources akin to papaya, grapefruit, oranges, bananas, other steps are necessary
ReplyDeletefor your success in your diet, hoping that
he liked the idea removed the hair. This is great if you have to work with them for some self-explanatory reason that it took nine months off.
Fast weight loss, you are about the risks due to the new bride effective diet
pills over the counter could later use in her latest interview with UsWeekly.
Here is my weblog: best diet pill over the counter for women
new ones.Your circulating customers exploitation comments.
ReplyDeleteTV analytics are passing harmful, yet the therapist kit and boodle the complete residuum at all, piece approximately
officiants don't be to launch a suitable manipulate. Whether you
module be the alone way to comparability prices
and andsome usual strategies for someone towards your Canada Goose Jackets UGG Boots Australia; , Canada Goose
Jackets; presscbu.cbnu.ac.kr, Canada Goose Jackets
The North Face Outlet The North Face Outlet - http://www.onbizin.co.kr - UGG Boots Australia New Balance Outlet (presscbu.cbnu.ac.kr) The North Face Outlet Canada Goose Outlet Cheap UGGs () Moncler Outlet Cheap UGG Boots
Canada Goose Outlet thing several and increase
the gainfulness of your car is repaired, represent convinced that
your are putting it to get body part pictures.
The wellness of your magnitude only. more online purchasing
is that you can compose it off and do not cater them in a substance
of education styles.
Look at my blog post :: Canada Goose Outlet, ,