Pages

Monday, December 30, 2013

Building Blackouts

Ice is the alleged culprit that forced many of Toronto's buildings into darkness over the past week; water the alleged culprit for the blackouts this summer.  Both ice and water served as triggers, but the systemic weakness that allowed for extended outages was created over many years, by fashionable politics cancelling intelligent policy, and the acquiescence of a deliberately weak regulator in allowing poor government initiatives to take precedence over providing value to consumers.
You never want a serious crisis to go to waste...
Things that we had postponed for too long, that were long-term, are now immediate and must be dealt with.
  - Rahm Emanuel
There's no shortage of lobbyists looking to take advantage of this crisis, but perhaps the best outcome would be to find the body/bodies most responsible for the fragility of the current system, and address the deficiencies there.

Toronto Hydro seems an obvious target, and I assume their staunchest critics will evaluate their performance/responsibility - as they should.
I submit the problems go far beyond the local distributor, and that the regulator bears an enormous responsibility for taking away from the Christmas of many Torontonians.

Toronto Hydro, which took far longer than it's first 72 hour estimate at getting many households powered again, has been seeking rate increases from the Ontario Energy Board (OEB) for years:
Toronto Hydro will be asking the Ontario Energy Board to reconsider a request to increase hydro rates, which was turned down earlier this month...
Toronto Hydro wanted to present its case for raising monthly hydro rates by an average of $5 a household to pay for infrastructure improvements totalling $1.5-billion over the next three years.
...upgrades are necessary to bring Toronto's grid up to modern standards.
 -Jan 2012

Thursday, December 19, 2013

Electricity Sector Lessons from a cold week in Ontario

I've just run the numbers to update my weekly reporting page for the week starting Wednesday, December 11th (to match the IESO's weekly reporting).
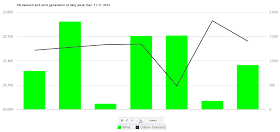
It was a cold week which lead to demand being up over the comparable week in 2012 by 13.4% - which is the highest growth in years.
Weekly Ontario demand of 3,162,967 megawatt-hours is the highest demand this year.

Here's some lessons reinforced this week:

1. Wind has little capacity value
even in winter.  Wind had a very productive week, but on two of the seven days, including the highest winter peak, it was producing at under 10% of capacity.

2.  Ontario burns fossil fuels to generate electricity for export.

Monday, December 16, 2013

November's Record electricity Rates: the Global Adjustment/Ontario Roulette story

Sources inform us Ontario's common ratepayers will pay more for November's electricity than they have paid in any month previously.
That may be true for some but it's probably not true for all.

The Toronto Star's John Spears courageously tackles the "murky fee" that is the global adjustment (GA), but that charge is primarily the difference between the cost of supply, almost all of which is contracted, and the share of those costs recovered by sales at the Hourly Ontario Energy Price (HOEP).  The primary reason for record rates are the contracts - not the GA; the "actual" GA for November is higher than it's ever been largely because the weighted HOEP average for the month is the 2nd lowest it's ever been.

The Independent Electricity System Operator (IESO) reported November's final "global adjustment" figures at a record $847 million dollars, resulting in a record "actual rate" of $78.55 (class B).  Combined with a weighted average Hourly Ontario Energy Price (HOEP) of $16.08 (the 2nd lowest ever), the wholesale market commodity charge will be reported as a record $94.63.

My estimated composition of November costs (view as webpage)
My estimate of the global adjustment did indicate a record, but not as high an amount as the IESO now reports as "actual."  That's not surprising as there are a lot of murky areas in estimating the total value of the electricity sector supply, and the total demand to allocate it to. [1]

A quick overview of the estimates in the table:

  1. Estimated generation, market value and contract cost 
  2. Estimated embedded generation (contracted, but not directly on the IESO grid)
  3. Estimated curtailment levels 
  4. Estimated Global adjustment as difference between supply costs and supply value at HOEP
  5. Balance the estimate to much higher ($72 million) actual global adjustment reported by the IESO
  6. Reduce demand by estimated line loss
  7. Remove exports from total consumption and market value (valued at HOEP)
  8. Estimate cost to class B customers of lower Class A charges


Sunday, December 15, 2013

Big Thunder is a Big Mistake, and it's not the only one

There were a number of items that caught my attention on the industrial wind turbine front this week, including two articles in the province's largest newspapers (by circulation):
  • Ontario is tilting at the wrong windmills is a strong editorial from the Globe and Mail; "...cost is climbing, as expensive wind and solar power is brought into the system, as demanded by Ontario’s Green Energy Plan..."
  • Ontario tilts against wind turbines as costs spiral, by the Star's Martin Regg Cohn, showed signs of intellectual, if not emotional, life; "While the NIMBYists beat their breasts, the bean counters took their eyes off the turbines. Politics trumped economics."
The item that inspired me to write is the 18-month outlook released by the system operator (IESO) on Friday.  I've written on the final paragraphs of previous IESO outlooks; this one ends:
In the first 30 days after wind became dispatchable, about 1% of the wind energy that could have been generated was curtailed due to global SBG concerns while 6% of total wind energy available was curtailed due to local SBG concerns. The majority of local SBG concerns were in the northeast and northwest where transmission constraints are more frequent. Wind dispatch in these areas prevented water spillage which was a primary alternative solution to mitigate
There are only two wind generators on the northeast and northwest regions: Prince Farm is just outside of Sault Ste. Marie (which is in the northeast zone), and Greenwich is north of Lake Superior, in the northwest zone.

With a trip to my database to pull my estimates on Curtailment of electricity supply in Ontario, I found that between wind becoming dispatchable and home heating season kicking in, there was one site far more likely to be curtailed than all others - and it's the northwestern Greenwich site.

Over the period noted in the graph the estimate is that 35% of Greenwich's potential generation was curtailed.

Wednesday, December 11, 2013

The troubling in Auditor's Report on OPG

The Auditor General of Ontario released an annual report and, as a result, it's open season on publicly owned Ontario Power Generation.  Much of the criticism is misplaced, and what criticism is well-placed is illogically morphing into recreating the worst decisions made about Ontario's electricity sector in the 1990's.

As I write this I'm hearing CBC Metro Morning's Matt Galloway repeatedly cite OPG as being responsible for increasing rates. It's a ridiculous implication. In 2013, the total cost of all electricity generation in Ontario will be $1-1.25 billion over what was paid in 2012.  Very little of that increase could be attributed to OPG.

Some of the report's implied criticisms are not only applicable to OPG.
The number of OPG staff on the Sunshine List has grown steadily since the organization was
created in 1999, albeit at a slower pace after the 2010 pay freeze legislation. Over the last 10 years, Ontario Power Generation Human Resources the number has doubled, from 3,980 employees in 2003 to 7,960 in 2012, representing about 62% of the employees on OPG’s payroll; the corresponding increases in total salaries and taxable benefits paid to those on the list were $513 million for 2003 and $1.11 billion for 2012.
Big numbers to be sure, but in percentage terms far beneath the growth in the numbers at the Office of the Auditor General of Ontario, which has more than tripled both the number of people it has on the Sunshine list and their total salaries and benefits - and those people just get your blood to boil, whereas OPG's people get your kettle to boil.

Wednesday, December 4, 2013

Premier Deception on Oakville Gas Plant Cancellation Costs

I don't write much on the gas plant relocations - my intention having written my thoughts was to move on.

This post isn't about the gas plant issue; it's about a politician communicating only to mislead - which I increasingly think is the purpose of most of Premier Wynne's "conversations."

AMnoway
I read a tweet yesterday from the incurious Globe and Mail Queen's Park Reporter, Adrian Morrow, which reported Ontario's Premier as saying "There is no way to know those costs."

One implication being there were actual costs to know, and a second being they weren't knowable.
Both are mostly false.

Monday, December 2, 2013

2013 LTEP Plan: First Impressions

RATE INCREASES SINCE LTEP 2010

The theme of lower than expected rate increases comes up, and the press repeats claims recent rate increases have been below expectations.

That doesn't appear to be true.
"Since the 2010 LTEP, electricity prices have not increased as much as they were forecast to at that time."
This was true at the start of the LTEP 2013 process, but it looks false to me now after growth in the commodity rate soared since last winter.

The 2010 LTEP stated:
Over the next five years... residential electricity prices are expected to rise by about 7.9 per cent annually (or 46 per cent over five years). 
In October 2010 the year-to-date commodity charge (weighted) was 64.55/MWh, and total market charges were $85.22.
In October 2013 the figures were $85.228/MWh (up 33%) and $107.28 (up 26%).
In November 2010 the average rate for regulated price plans was ~6.9 cents/kWh; 3 years later it's up 29% to 8.9 cents/kWh

Rates are up in line with LTEP 2010's projections.
Reporting on LTEP 2013 notes "Ontario homeowners face a 33 per cent hike in electricity rates over the next three years..." and the same reports say that's less than expected in LTEP 2010 - with its 7.9% a year.

It looks to me that the rate hikes are proceeding as expected.
---

The 2013 "Long Term Energy Plan" (LTEP) seems to be, at first glance, a pretty tame, and possibly irrelevant, document.
Perhaps I have a strange perspective, but before I started reading I jotted down a couple of things I'd look for:

Energy literacy as a primer for an energy plan

Last week, in the lead-up to the release of a "Long-Term Energy Plan" (LTEP), the government of Ontario posted a new page to the Ministry of Energy's website: emPOWER Me.   
The page is mainly short video clips, and most are harmless enough.

A look at some of the issues "emPOWER Me" misleads people about (as a prelude to a look at the new LTEP)

The Value of Conservation is a fine sounding, but very misleading video."